Immigrants from Congo vs Puerto Rican Female Poverty Among 25-34 Year Olds
COMPARE
Immigrants from Congo
Puerto Rican
Female Poverty Among 25-34 Year Olds
Female Poverty Among 25-34 Year Olds Comparison
Immigrants from Congo
Puerto Ricans
16.7%
FEMALE POVERTY AMONG 25-34 YEAR OLDS
0.0/ 100
METRIC RATING
301st/ 347
METRIC RANK
26.3%
FEMALE POVERTY AMONG 25-34 YEAR OLDS
0.0/ 100
METRIC RATING
347th/ 347
METRIC RANK
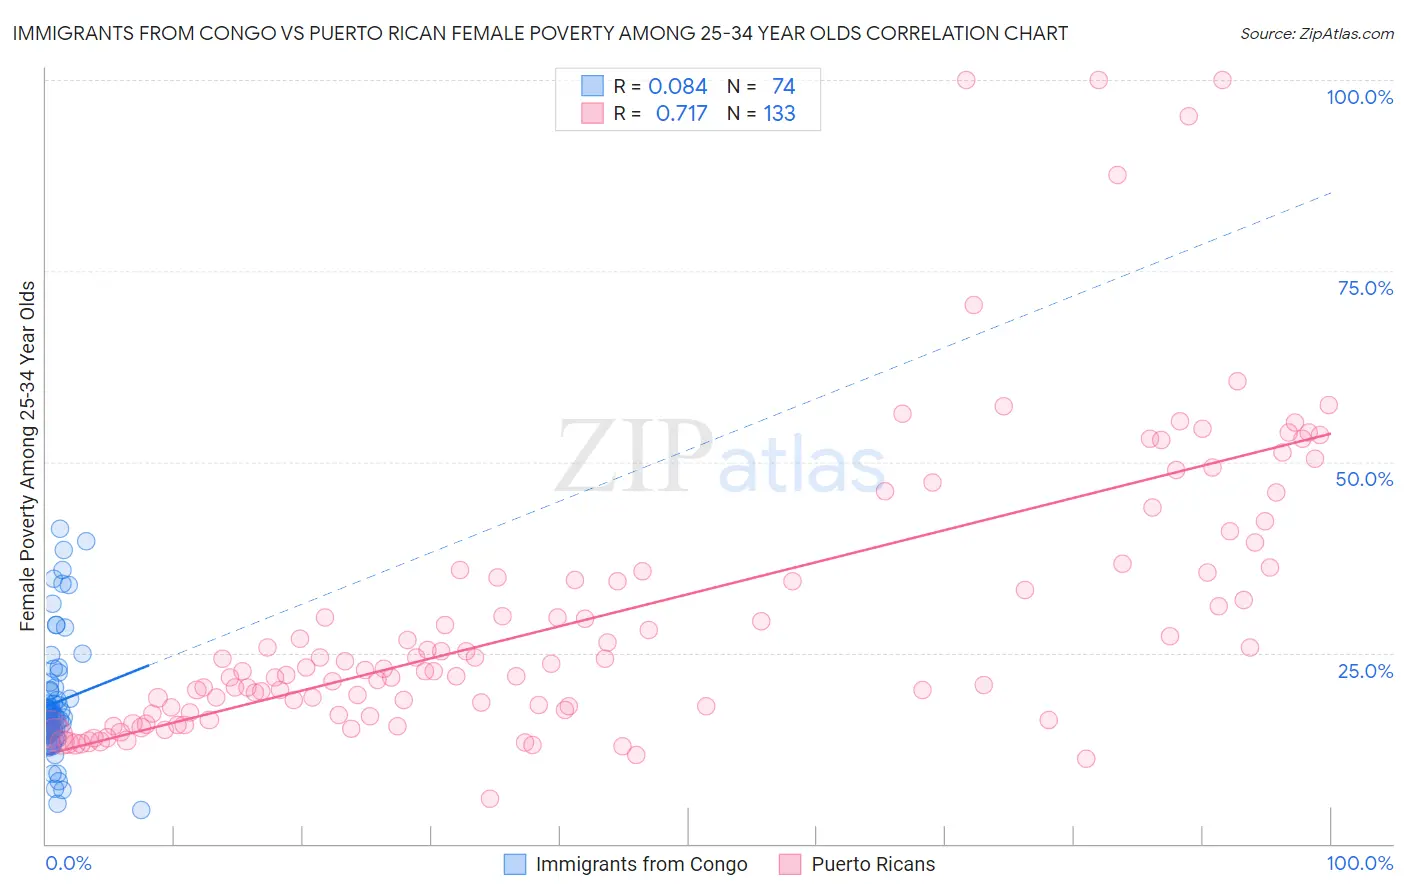
Immigrants from Congo vs Puerto Rican Female Poverty Among 25-34 Year Olds Correlation Chart
The statistical analysis conducted on geographies consisting of 91,915,902 people shows a slight positive correlation between the proportion of Immigrants from Congo and poverty level among females between the ages 25 and 34 in the United States with a correlation coefficient (R) of 0.084 and weighted average of 16.7%. Similarly, the statistical analysis conducted on geographies consisting of 514,481,871 people shows a strong positive correlation between the proportion of Puerto Ricans and poverty level among females between the ages 25 and 34 in the United States with a correlation coefficient (R) of 0.717 and weighted average of 26.3%, a difference of 57.0%.
Female Poverty Among 25-34 Year Olds Correlation Summary
| Measurement | Immigrants from Congo | Puerto Rican |
| Minimum | 4.4% | 6.0% |
| Maximum | 41.2% | 100.0% |
| Range | 36.8% | 94.0% |
| Mean | 18.5% | 30.0% |
| Median | 16.8% | 22.9% |
| Interquartile 25% (IQ1) | 14.5% | 17.3% |
| Interquartile 75% (IQ3) | 20.1% | 35.8% |
| Interquartile Range (IQR) | 5.7% | 18.5% |
| Standard Deviation (Sample) | 7.8% | 19.0% |
| Standard Deviation (Population) | 7.7% | 18.9% |
Similar Demographics by Female Poverty Among 25-34 Year Olds
Demographics Similar to Immigrants from Congo by Female Poverty Among 25-34 Year Olds
In terms of female poverty among 25-34 year olds, the demographic groups most similar to Immigrants from Congo are U.S. Virgin Islander (16.7%, a difference of 0.010%), Alaska Native (16.8%, a difference of 0.11%), Spanish American (16.7%, a difference of 0.16%), Blackfeet (16.7%, a difference of 0.20%), and Immigrants from Mexico (16.8%, a difference of 0.43%).
| Demographics | Rating | Rank | Female Poverty Among 25-34 Year Olds |
| Immigrants | Central America | 0.0 /100 | #294 | Tragic 16.6% |
| Mexicans | 0.0 /100 | #295 | Tragic 16.6% |
| Hispanics or Latinos | 0.0 /100 | #296 | Tragic 16.6% |
| Immigrants | Guatemala | 0.0 /100 | #297 | Tragic 16.6% |
| Blackfeet | 0.0 /100 | #298 | Tragic 16.7% |
| Spanish Americans | 0.0 /100 | #299 | Tragic 16.7% |
| U.S. Virgin Islanders | 0.0 /100 | #300 | Tragic 16.7% |
| Immigrants | Congo | 0.0 /100 | #301 | Tragic 16.7% |
| Alaska Natives | 0.0 /100 | #302 | Tragic 16.8% |
| Immigrants | Mexico | 0.0 /100 | #303 | Tragic 16.8% |
| Hondurans | 0.0 /100 | #304 | Tragic 16.9% |
| Immigrants | Cabo Verde | 0.0 /100 | #305 | Tragic 16.9% |
| Chickasaw | 0.0 /100 | #306 | Tragic 17.0% |
| Yaqui | 0.0 /100 | #307 | Tragic 17.0% |
| Africans | 0.0 /100 | #308 | Tragic 17.0% |
Demographics Similar to Puerto Ricans by Female Poverty Among 25-34 Year Olds
In terms of female poverty among 25-34 year olds, the demographic groups most similar to Puerto Ricans are Lumbee (26.3%, a difference of 0.030%), Pima (25.3%, a difference of 3.9%), Tohono O'odham (24.7%, a difference of 6.2%), Yup'ik (24.3%, a difference of 8.1%), and Hopi (23.7%, a difference of 11.0%).
| Demographics | Rating | Rank | Female Poverty Among 25-34 Year Olds |
| Cajuns | 0.0 /100 | #333 | Tragic 19.9% |
| Apache | 0.0 /100 | #334 | Tragic 20.1% |
| Natives/Alaskans | 0.0 /100 | #335 | Tragic 20.3% |
| Pueblo | 0.0 /100 | #336 | Tragic 22.2% |
| Crow | 0.0 /100 | #337 | Tragic 22.7% |
| Houma | 0.0 /100 | #338 | Tragic 22.7% |
| Yuman | 0.0 /100 | #339 | Tragic 22.9% |
| Sioux | 0.0 /100 | #340 | Tragic 23.0% |
| Navajo | 0.0 /100 | #341 | Tragic 23.3% |
| Hopi | 0.0 /100 | #342 | Tragic 23.7% |
| Yup'ik | 0.0 /100 | #343 | Tragic 24.3% |
| Tohono O'odham | 0.0 /100 | #344 | Tragic 24.7% |
| Pima | 0.0 /100 | #345 | Tragic 25.3% |
| Lumbee | 0.0 /100 | #346 | Tragic 26.3% |
| Puerto Ricans | 0.0 /100 | #347 | Tragic 26.3% |