Korean vs Puerto Rican Ambulatory Disability
COMPARE
Korean
Puerto Rican
Ambulatory Disability
Ambulatory Disability Comparison
Koreans
Puerto Ricans
5.9%
AMBULATORY DISABILITY
91.6/ 100
METRIC RATING
125th/ 347
METRIC RANK
8.9%
AMBULATORY DISABILITY
0.0/ 100
METRIC RATING
345th/ 347
METRIC RANK
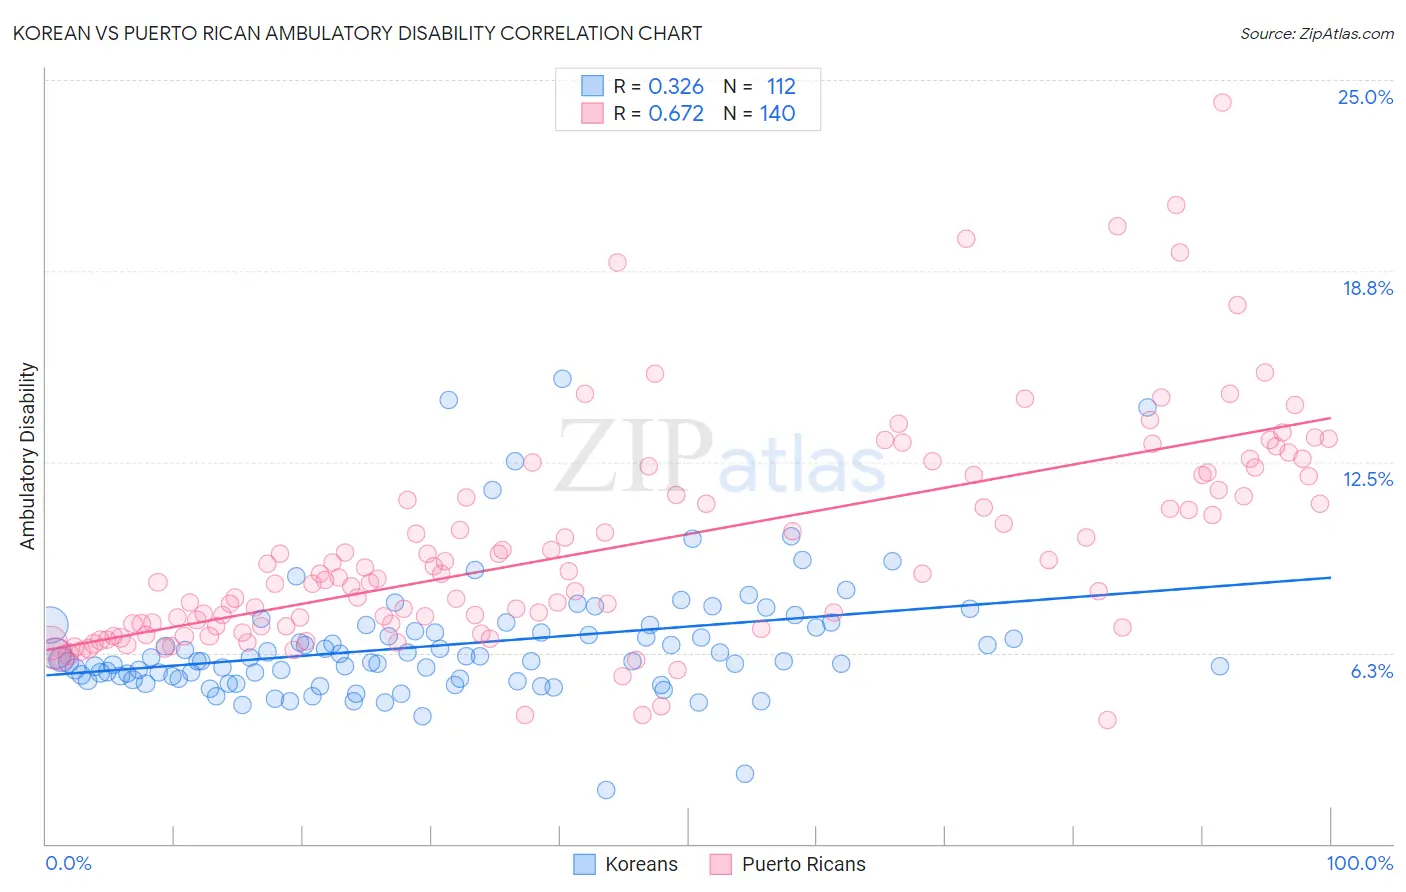
Korean vs Puerto Rican Ambulatory Disability Correlation Chart
The statistical analysis conducted on geographies consisting of 510,581,293 people shows a mild positive correlation between the proportion of Koreans and percentage of population with ambulatory disability in the United States with a correlation coefficient (R) of 0.326 and weighted average of 5.9%. Similarly, the statistical analysis conducted on geographies consisting of 527,889,782 people shows a significant positive correlation between the proportion of Puerto Ricans and percentage of population with ambulatory disability in the United States with a correlation coefficient (R) of 0.672 and weighted average of 8.9%, a difference of 49.8%.
Ambulatory Disability Correlation Summary
| Measurement | Korean | Puerto Rican |
| Minimum | 1.8% | 4.0% |
| Maximum | 15.2% | 24.3% |
| Range | 13.4% | 20.2% |
| Mean | 6.5% | 9.7% |
| Median | 6.0% | 8.7% |
| Interquartile 25% (IQ1) | 5.4% | 7.1% |
| Interquartile 75% (IQ3) | 7.0% | 11.8% |
| Interquartile Range (IQR) | 1.6% | 4.7% |
| Standard Deviation (Sample) | 2.0% | 3.6% |
| Standard Deviation (Population) | 2.0% | 3.6% |
Similar Demographics by Ambulatory Disability
Demographics Similar to Koreans by Ambulatory Disability
In terms of ambulatory disability, the demographic groups most similar to Koreans are Arab (5.9%, a difference of 0.020%), Immigrants from Nigeria (5.9%, a difference of 0.11%), Immigrants from Middle Africa (5.9%, a difference of 0.12%), Immigrants from Western Asia (5.9%, a difference of 0.15%), and Immigrants from Russia (5.9%, a difference of 0.16%).
| Demographics | Rating | Rank | Ambulatory Disability |
| Russians | 93.4 /100 | #118 | Exceptional 5.9% |
| Norwegians | 93.1 /100 | #119 | Exceptional 5.9% |
| Estonians | 92.9 /100 | #120 | Exceptional 5.9% |
| Costa Ricans | 92.6 /100 | #121 | Exceptional 5.9% |
| Icelanders | 92.6 /100 | #122 | Exceptional 5.9% |
| Immigrants | Russia | 92.4 /100 | #123 | Exceptional 5.9% |
| Immigrants | Middle Africa | 92.2 /100 | #124 | Exceptional 5.9% |
| Koreans | 91.6 /100 | #125 | Exceptional 5.9% |
| Arabs | 91.5 /100 | #126 | Exceptional 5.9% |
| Immigrants | Nigeria | 90.9 /100 | #127 | Exceptional 5.9% |
| Immigrants | Western Asia | 90.7 /100 | #128 | Exceptional 5.9% |
| Immigrants | Norway | 90.5 /100 | #129 | Exceptional 5.9% |
| Immigrants | Kazakhstan | 89.7 /100 | #130 | Excellent 5.9% |
| Immigrants | Costa Rica | 89.5 /100 | #131 | Excellent 5.9% |
| Immigrants | Europe | 87.8 /100 | #132 | Excellent 6.0% |
Demographics Similar to Puerto Ricans by Ambulatory Disability
In terms of ambulatory disability, the demographic groups most similar to Puerto Ricans are Tsimshian (8.8%, a difference of 0.59%), Tohono O'odham (8.7%, a difference of 1.6%), Kiowa (8.6%, a difference of 3.1%), Houma (9.3%, a difference of 4.9%), and Creek (8.5%, a difference of 5.0%).
| Demographics | Rating | Rank | Ambulatory Disability |
| Cherokee | 0.0 /100 | #333 | Tragic 7.9% |
| Yuman | 0.0 /100 | #334 | Tragic 7.9% |
| Chickasaw | 0.0 /100 | #335 | Tragic 8.0% |
| Seminole | 0.0 /100 | #336 | Tragic 8.0% |
| Dutch West Indians | 0.0 /100 | #337 | Tragic 8.2% |
| Colville | 0.0 /100 | #338 | Tragic 8.2% |
| Pima | 0.0 /100 | #339 | Tragic 8.2% |
| Choctaw | 0.0 /100 | #340 | Tragic 8.3% |
| Creek | 0.0 /100 | #341 | Tragic 8.5% |
| Kiowa | 0.0 /100 | #342 | Tragic 8.6% |
| Tohono O'odham | 0.0 /100 | #343 | Tragic 8.7% |
| Tsimshian | 0.0 /100 | #344 | Tragic 8.8% |
| Puerto Ricans | 0.0 /100 | #345 | Tragic 8.9% |
| Houma | 0.0 /100 | #346 | Tragic 9.3% |
| Lumbee | 0.0 /100 | #347 | Tragic 9.5% |