Immigrants from Congo vs Puerto Rican Male Disability
COMPARE
Immigrants from Congo
Puerto Rican
Male Disability
Male Disability Comparison
Immigrants from Congo
Puerto Ricans
11.7%
MALE DISABILITY
3.7/ 100
METRIC RATING
221st/ 347
METRIC RANK
15.6%
MALE DISABILITY
0.0/ 100
METRIC RATING
344th/ 347
METRIC RANK
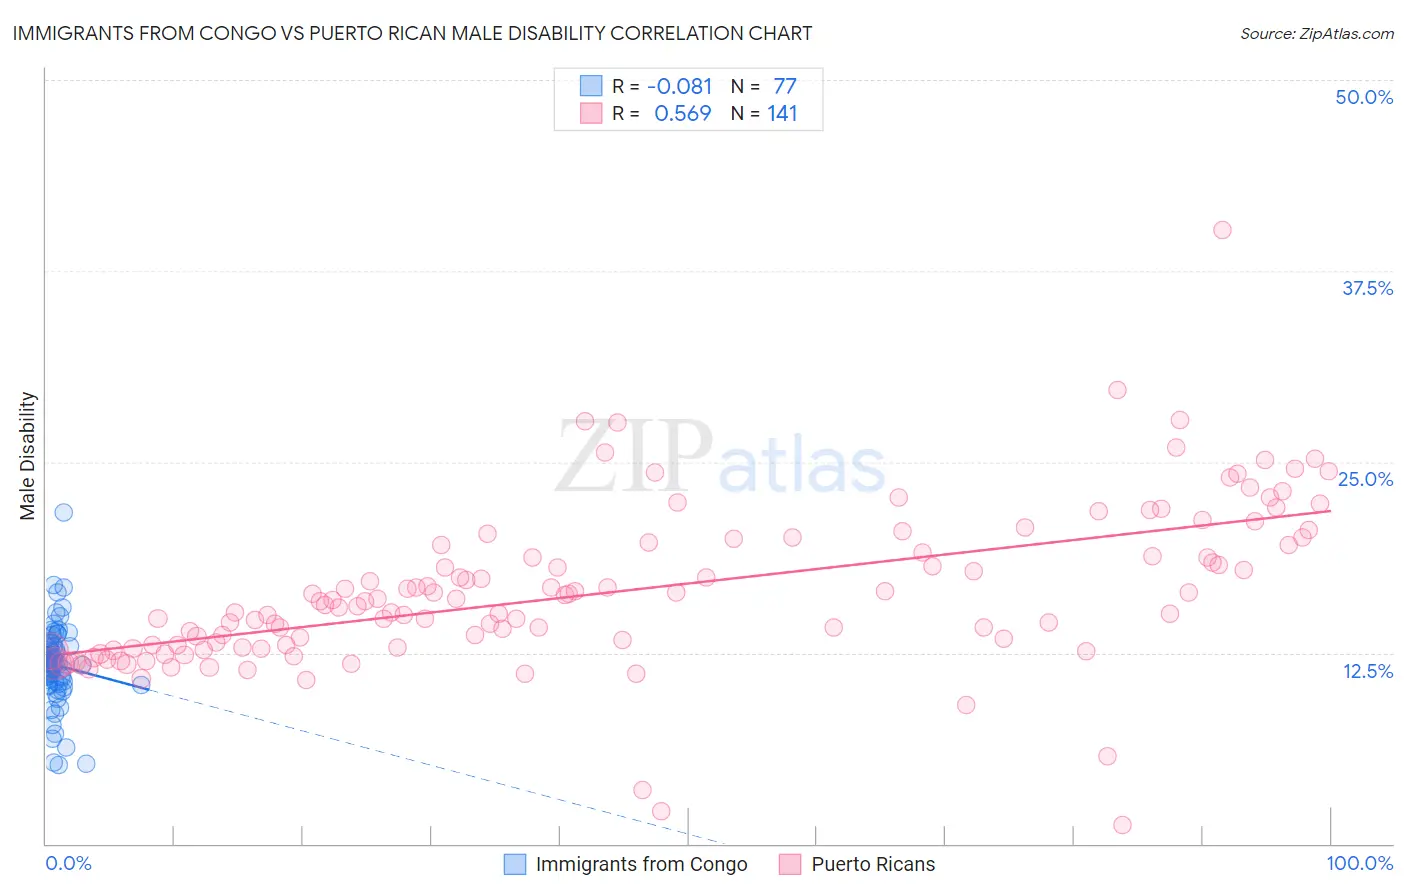
Immigrants from Congo vs Puerto Rican Male Disability Correlation Chart
The statistical analysis conducted on geographies consisting of 92,121,223 people shows a slight negative correlation between the proportion of Immigrants from Congo and percentage of males with a disability in the United States with a correlation coefficient (R) of -0.081 and weighted average of 11.7%. Similarly, the statistical analysis conducted on geographies consisting of 528,075,893 people shows a substantial positive correlation between the proportion of Puerto Ricans and percentage of males with a disability in the United States with a correlation coefficient (R) of 0.569 and weighted average of 15.6%, a difference of 32.7%.
Male Disability Correlation Summary
| Measurement | Immigrants from Congo | Puerto Rican |
| Minimum | 5.1% | 1.3% |
| Maximum | 21.7% | 40.1% |
| Range | 16.5% | 38.9% |
| Mean | 11.7% | 16.5% |
| Median | 11.8% | 15.9% |
| Interquartile 25% (IQ1) | 10.6% | 12.9% |
| Interquartile 75% (IQ3) | 12.9% | 19.5% |
| Interquartile Range (IQR) | 2.4% | 6.7% |
| Standard Deviation (Sample) | 2.7% | 5.3% |
| Standard Deviation (Population) | 2.6% | 5.3% |
Similar Demographics by Male Disability
Demographics Similar to Immigrants from Congo by Male Disability
In terms of male disability, the demographic groups most similar to Immigrants from Congo are Immigrants from Western Europe (11.7%, a difference of 0.010%), Panamanian (11.7%, a difference of 0.020%), Immigrants from England (11.7%, a difference of 0.080%), Alsatian (11.7%, a difference of 0.15%), and Immigrants from Bahamas (11.7%, a difference of 0.24%).
| Demographics | Rating | Rank | Male Disability |
| Lithuanians | 6.6 /100 | #214 | Tragic 11.6% |
| Indonesians | 5.9 /100 | #215 | Tragic 11.6% |
| Immigrants | Dominican Republic | 4.9 /100 | #216 | Tragic 11.7% |
| Immigrants | Dominica | 4.6 /100 | #217 | Tragic 11.7% |
| Immigrants | England | 4.0 /100 | #218 | Tragic 11.7% |
| Panamanians | 3.8 /100 | #219 | Tragic 11.7% |
| Immigrants | Western Europe | 3.8 /100 | #220 | Tragic 11.7% |
| Immigrants | Congo | 3.7 /100 | #221 | Tragic 11.7% |
| Alsatians | 3.3 /100 | #222 | Tragic 11.7% |
| Immigrants | Bahamas | 3.2 /100 | #223 | Tragic 11.7% |
| Japanese | 3.1 /100 | #224 | Tragic 11.7% |
| Liberians | 3.1 /100 | #225 | Tragic 11.8% |
| Sub-Saharan Africans | 2.8 /100 | #226 | Tragic 11.8% |
| Austrians | 2.5 /100 | #227 | Tragic 11.8% |
| Hispanics or Latinos | 2.3 /100 | #228 | Tragic 11.8% |
Demographics Similar to Puerto Ricans by Male Disability
In terms of male disability, the demographic groups most similar to Puerto Ricans are Creek (15.5%, a difference of 0.13%), Tsimshian (15.6%, a difference of 0.32%), Kiowa (15.4%, a difference of 0.79%), Choctaw (15.4%, a difference of 0.98%), and Lumbee (15.2%, a difference of 2.1%).
| Demographics | Rating | Rank | Male Disability |
| Yuman | 0.0 /100 | #333 | Tragic 14.7% |
| Cherokee | 0.0 /100 | #334 | Tragic 14.8% |
| Dutch West Indians | 0.0 /100 | #335 | Tragic 14.8% |
| Alaskan Athabascans | 0.0 /100 | #336 | Tragic 14.9% |
| Menominee | 0.0 /100 | #337 | Tragic 15.0% |
| Pueblo | 0.0 /100 | #338 | Tragic 15.0% |
| Chickasaw | 0.0 /100 | #339 | Tragic 15.1% |
| Lumbee | 0.0 /100 | #340 | Tragic 15.2% |
| Choctaw | 0.0 /100 | #341 | Tragic 15.4% |
| Kiowa | 0.0 /100 | #342 | Tragic 15.4% |
| Creek | 0.0 /100 | #343 | Tragic 15.5% |
| Puerto Ricans | 0.0 /100 | #344 | Tragic 15.6% |
| Tsimshian | 0.0 /100 | #345 | Tragic 15.6% |
| Colville | 0.0 /100 | #346 | Tragic 16.5% |
| Houma | 0.0 /100 | #347 | Tragic 17.4% |