Immigrants from Congo vs Nicaraguan Ambulatory Disability
COMPARE
Immigrants from Congo
Nicaraguan
Ambulatory Disability
Ambulatory Disability Comparison
Immigrants from Congo
Nicaraguans
6.2%
AMBULATORY DISABILITY
18.2/ 100
METRIC RATING
204th/ 347
METRIC RANK
6.1%
AMBULATORY DISABILITY
63.2/ 100
METRIC RATING
165th/ 347
METRIC RANK
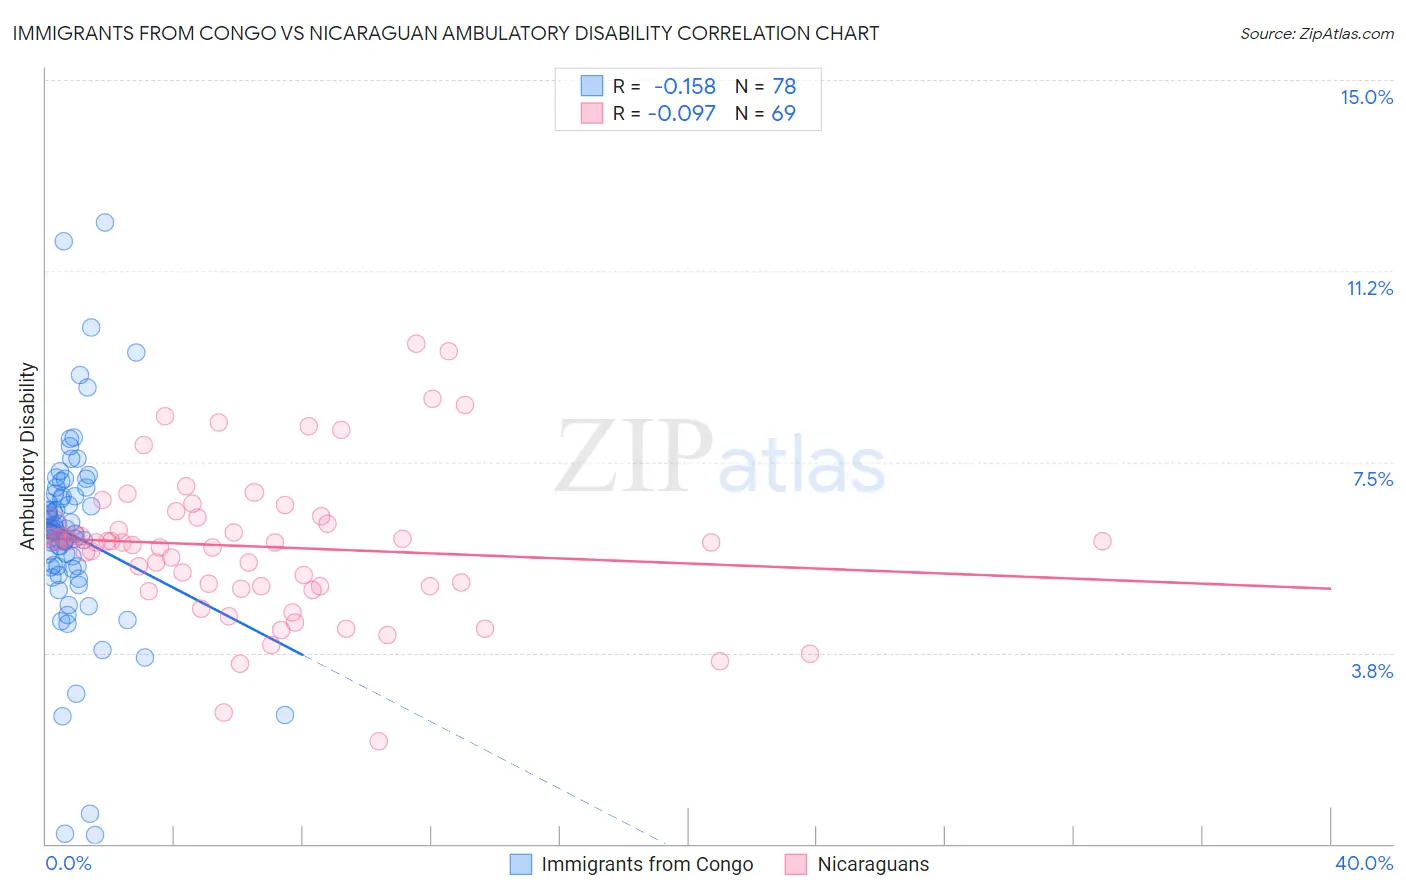
Immigrants from Congo vs Nicaraguan Ambulatory Disability Correlation Chart
The statistical analysis conducted on geographies consisting of 92,115,389 people shows a poor negative correlation between the proportion of Immigrants from Congo and percentage of population with ambulatory disability in the United States with a correlation coefficient (R) of -0.158 and weighted average of 6.2%. Similarly, the statistical analysis conducted on geographies consisting of 285,681,314 people shows a slight negative correlation between the proportion of Nicaraguans and percentage of population with ambulatory disability in the United States with a correlation coefficient (R) of -0.097 and weighted average of 6.1%, a difference of 2.7%.
Ambulatory Disability Correlation Summary
| Measurement | Immigrants from Congo | Nicaraguan |
| Minimum | 0.17% | 2.0% |
| Maximum | 12.2% | 9.8% |
| Range | 12.0% | 7.8% |
| Mean | 6.1% | 5.8% |
| Median | 6.1% | 5.9% |
| Interquartile 25% (IQ1) | 5.4% | 5.0% |
| Interquartile 75% (IQ3) | 6.9% | 6.4% |
| Interquartile Range (IQR) | 1.5% | 1.4% |
| Standard Deviation (Sample) | 2.0% | 1.5% |
| Standard Deviation (Population) | 2.0% | 1.5% |
Similar Demographics by Ambulatory Disability
Demographics Similar to Immigrants from Congo by Ambulatory Disability
In terms of ambulatory disability, the demographic groups most similar to Immigrants from Congo are Immigrants from Ukraine (6.2%, a difference of 0.010%), Slovene (6.2%, a difference of 0.020%), Finnish (6.2%, a difference of 0.090%), Albanian (6.2%, a difference of 0.13%), and Immigrants from Central America (6.2%, a difference of 0.15%).
| Demographics | Rating | Rank | Ambulatory Disability |
| Poles | 26.3 /100 | #197 | Fair 6.2% |
| Immigrants | Bangladesh | 24.6 /100 | #198 | Fair 6.2% |
| Italians | 22.6 /100 | #199 | Fair 6.2% |
| Immigrants | Cambodia | 21.5 /100 | #200 | Fair 6.2% |
| Immigrants | Central America | 20.1 /100 | #201 | Fair 6.2% |
| Albanians | 19.7 /100 | #202 | Poor 6.2% |
| Immigrants | Ukraine | 18.4 /100 | #203 | Poor 6.2% |
| Immigrants | Congo | 18.2 /100 | #204 | Poor 6.2% |
| Slovenes | 18.0 /100 | #205 | Poor 6.2% |
| Finns | 17.2 /100 | #206 | Poor 6.2% |
| Alsatians | 15.1 /100 | #207 | Poor 6.3% |
| Bangladeshis | 14.2 /100 | #208 | Poor 6.3% |
| Immigrants | Iraq | 14.0 /100 | #209 | Poor 6.3% |
| Immigrants | Laos | 13.2 /100 | #210 | Poor 6.3% |
| Samoans | 12.1 /100 | #211 | Poor 6.3% |
Demographics Similar to Nicaraguans by Ambulatory Disability
In terms of ambulatory disability, the demographic groups most similar to Nicaraguans are Iraqi (6.1%, a difference of 0.020%), Basque (6.1%, a difference of 0.030%), Immigrants from Oceania (6.1%, a difference of 0.14%), Ecuadorian (6.1%, a difference of 0.15%), and Lebanese (6.1%, a difference of 0.18%).
| Demographics | Rating | Rank | Ambulatory Disability |
| Immigrants | Fiji | 71.2 /100 | #158 | Good 6.0% |
| Immigrants | Latvia | 71.1 /100 | #159 | Good 6.0% |
| Central Americans | 69.8 /100 | #160 | Good 6.0% |
| Immigrants | Belarus | 69.2 /100 | #161 | Good 6.1% |
| Nigerians | 67.1 /100 | #162 | Good 6.1% |
| Lebanese | 66.2 /100 | #163 | Good 6.1% |
| Basques | 63.7 /100 | #164 | Good 6.1% |
| Nicaraguans | 63.2 /100 | #165 | Good 6.1% |
| Iraqis | 62.8 /100 | #166 | Good 6.1% |
| Immigrants | Oceania | 60.7 /100 | #167 | Good 6.1% |
| Ecuadorians | 60.5 /100 | #168 | Good 6.1% |
| Immigrants | Southern Europe | 58.1 /100 | #169 | Average 6.1% |
| Immigrants | Ecuador | 53.8 /100 | #170 | Average 6.1% |
| Moroccans | 52.6 /100 | #171 | Average 6.1% |
| Immigrants | Burma/Myanmar | 52.2 /100 | #172 | Average 6.1% |