Immigrants from Congo vs Malaysian Ambulatory Disability
COMPARE
Immigrants from Congo
Malaysian
Ambulatory Disability
Ambulatory Disability Comparison
Immigrants from Congo
Malaysians
6.2%
AMBULATORY DISABILITY
18.2/ 100
METRIC RATING
204th/ 347
METRIC RANK
6.2%
AMBULATORY DISABILITY
28.2/ 100
METRIC RATING
196th/ 347
METRIC RANK
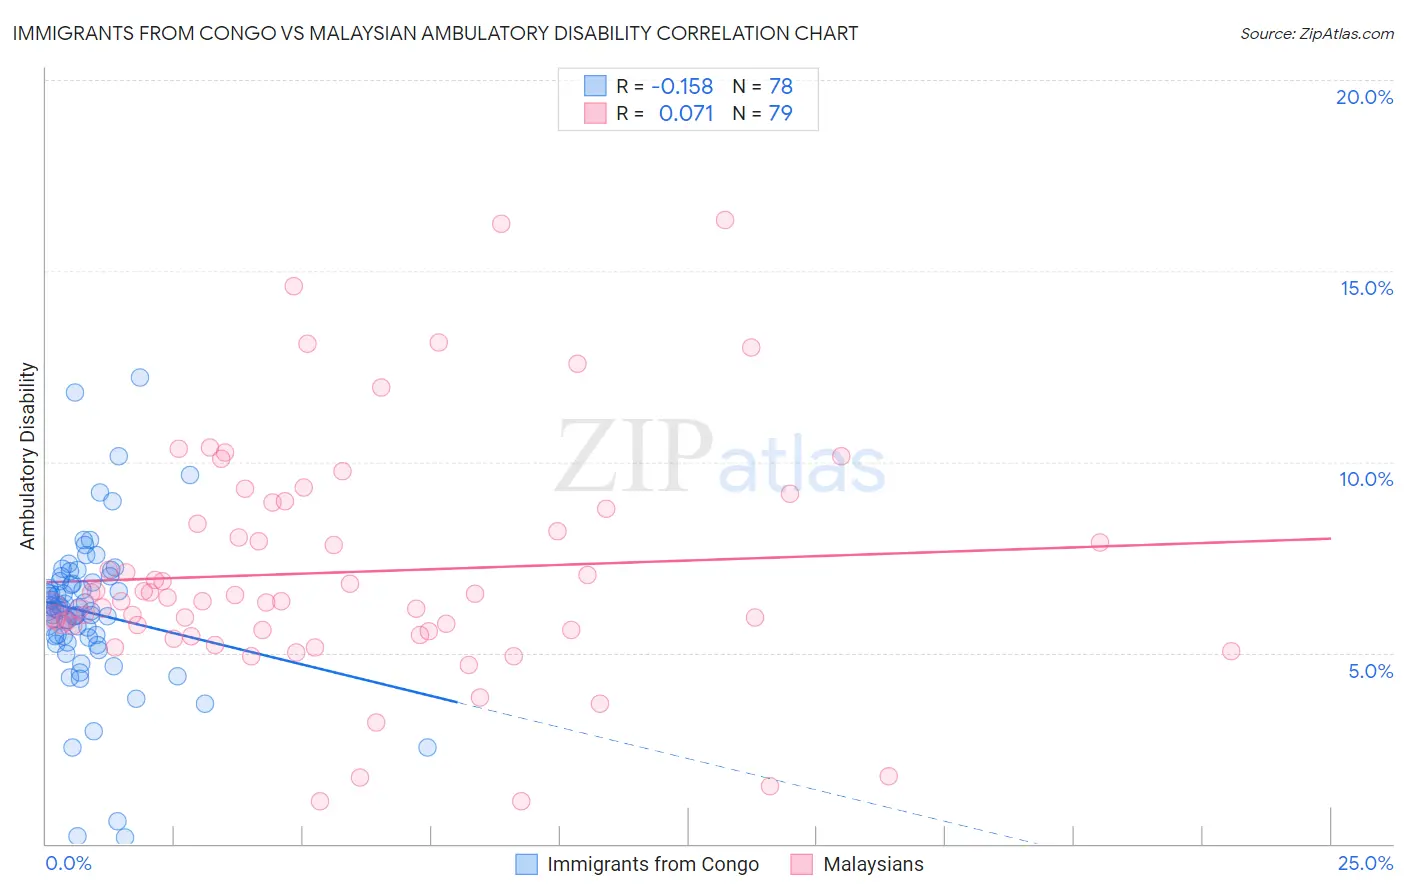
Immigrants from Congo vs Malaysian Ambulatory Disability Correlation Chart
The statistical analysis conducted on geographies consisting of 92,115,389 people shows a poor negative correlation between the proportion of Immigrants from Congo and percentage of population with ambulatory disability in the United States with a correlation coefficient (R) of -0.158 and weighted average of 6.2%. Similarly, the statistical analysis conducted on geographies consisting of 226,050,790 people shows a slight positive correlation between the proportion of Malaysians and percentage of population with ambulatory disability in the United States with a correlation coefficient (R) of 0.071 and weighted average of 6.2%, a difference of 0.74%.
Ambulatory Disability Correlation Summary
| Measurement | Immigrants from Congo | Malaysian |
| Minimum | 0.17% | 1.1% |
| Maximum | 12.2% | 16.3% |
| Range | 12.0% | 15.2% |
| Mean | 6.1% | 7.1% |
| Median | 6.1% | 6.4% |
| Interquartile 25% (IQ1) | 5.4% | 5.6% |
| Interquartile 75% (IQ3) | 6.9% | 8.8% |
| Interquartile Range (IQR) | 1.5% | 3.2% |
| Standard Deviation (Sample) | 2.0% | 3.1% |
| Standard Deviation (Population) | 2.0% | 3.1% |
Demographics Similar to Immigrants from Congo and Malaysians by Ambulatory Disability
In terms of ambulatory disability, the demographic groups most similar to Immigrants from Congo are Immigrants from Ukraine (6.2%, a difference of 0.010%), Slovene (6.2%, a difference of 0.020%), Finnish (6.2%, a difference of 0.090%), Albanian (6.2%, a difference of 0.13%), and Immigrants from Central America (6.2%, a difference of 0.15%). Similarly, the demographic groups most similar to Malaysians are Belgian (6.2%, a difference of 0.030%), Alaska Native (6.2%, a difference of 0.10%), Guatemalan (6.2%, a difference of 0.11%), Polish (6.2%, a difference of 0.12%), and Immigrants from Western Europe (6.2%, a difference of 0.21%).
| Demographics | Rating | Rank | Ambulatory Disability |
| Immigrants | Western Africa | 33.4 /100 | #190 | Fair 6.2% |
| Immigrants | Guatemala | 31.9 /100 | #191 | Fair 6.2% |
| Immigrants | Western Europe | 31.6 /100 | #192 | Fair 6.2% |
| Guatemalans | 30.0 /100 | #193 | Fair 6.2% |
| Alaska Natives | 29.8 /100 | #194 | Fair 6.2% |
| Belgians | 28.6 /100 | #195 | Fair 6.2% |
| Malaysians | 28.2 /100 | #196 | Fair 6.2% |
| Poles | 26.3 /100 | #197 | Fair 6.2% |
| Immigrants | Bangladesh | 24.6 /100 | #198 | Fair 6.2% |
| Italians | 22.6 /100 | #199 | Fair 6.2% |
| Immigrants | Cambodia | 21.5 /100 | #200 | Fair 6.2% |
| Immigrants | Central America | 20.1 /100 | #201 | Fair 6.2% |
| Albanians | 19.7 /100 | #202 | Poor 6.2% |
| Immigrants | Ukraine | 18.4 /100 | #203 | Poor 6.2% |
| Immigrants | Congo | 18.2 /100 | #204 | Poor 6.2% |
| Slovenes | 18.0 /100 | #205 | Poor 6.2% |
| Finns | 17.2 /100 | #206 | Poor 6.2% |
| Alsatians | 15.1 /100 | #207 | Poor 6.3% |
| Bangladeshis | 14.2 /100 | #208 | Poor 6.3% |
| Immigrants | Iraq | 14.0 /100 | #209 | Poor 6.3% |
| Immigrants | Laos | 13.2 /100 | #210 | Poor 6.3% |