Immigrants from Congo vs Icelander Ambulatory Disability
COMPARE
Immigrants from Congo
Icelander
Ambulatory Disability
Ambulatory Disability Comparison
Immigrants from Congo
Icelanders
6.2%
AMBULATORY DISABILITY
18.2/ 100
METRIC RATING
204th/ 347
METRIC RANK
5.9%
AMBULATORY DISABILITY
92.6/ 100
METRIC RATING
122nd/ 347
METRIC RANK
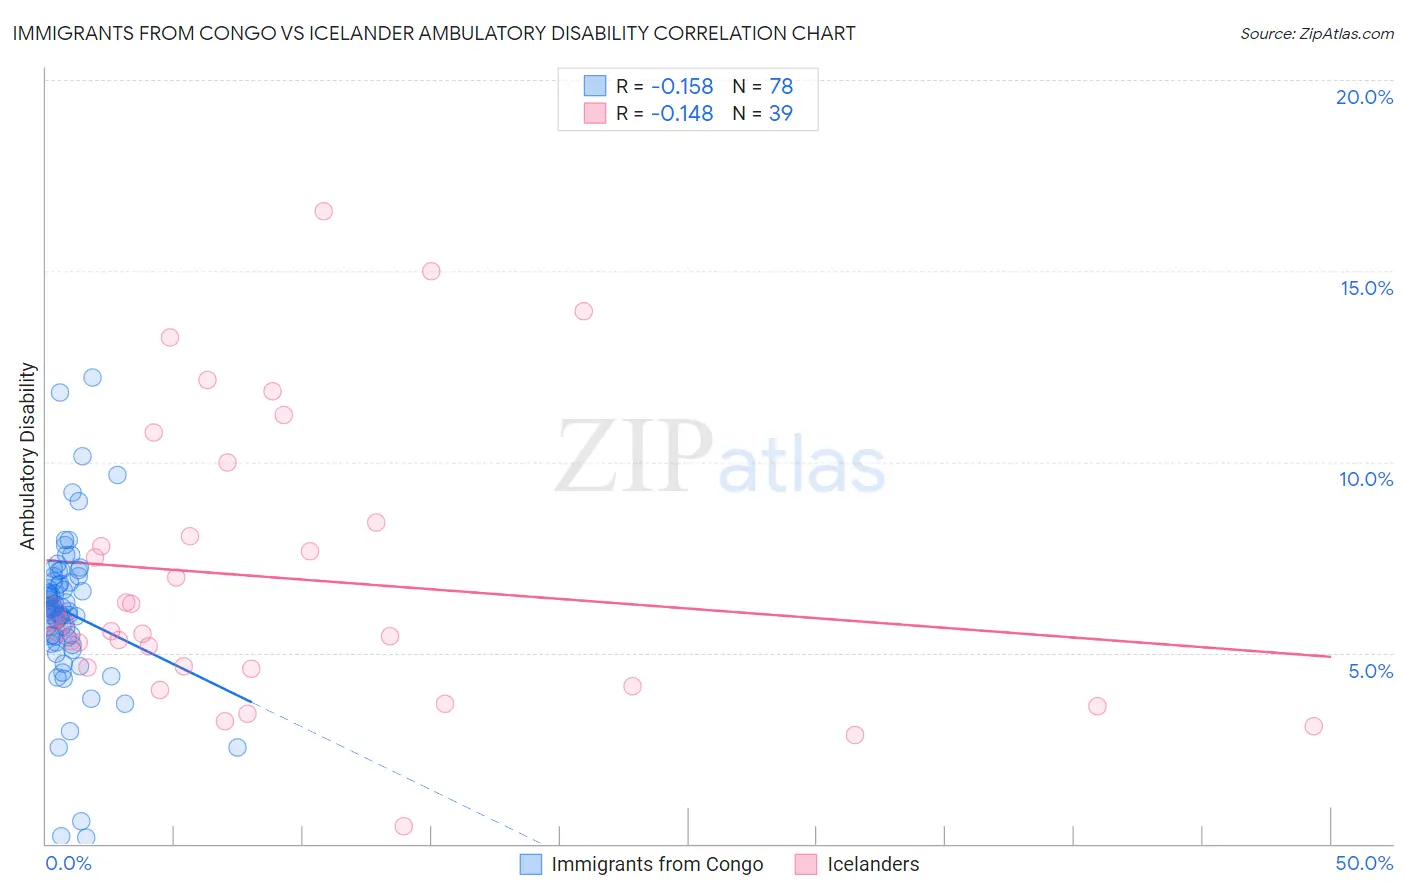
Immigrants from Congo vs Icelander Ambulatory Disability Correlation Chart
The statistical analysis conducted on geographies consisting of 92,115,389 people shows a poor negative correlation between the proportion of Immigrants from Congo and percentage of population with ambulatory disability in the United States with a correlation coefficient (R) of -0.158 and weighted average of 6.2%. Similarly, the statistical analysis conducted on geographies consisting of 159,642,692 people shows a poor negative correlation between the proportion of Icelanders and percentage of population with ambulatory disability in the United States with a correlation coefficient (R) of -0.148 and weighted average of 5.9%, a difference of 5.5%.
Ambulatory Disability Correlation Summary
| Measurement | Immigrants from Congo | Icelander |
| Minimum | 0.17% | 0.47% |
| Maximum | 12.2% | 16.5% |
| Range | 12.0% | 16.1% |
| Mean | 6.1% | 6.9% |
| Median | 6.1% | 5.6% |
| Interquartile 25% (IQ1) | 5.4% | 4.6% |
| Interquartile 75% (IQ3) | 6.9% | 8.4% |
| Interquartile Range (IQR) | 1.5% | 3.8% |
| Standard Deviation (Sample) | 2.0% | 3.7% |
| Standard Deviation (Population) | 2.0% | 3.7% |
Similar Demographics by Ambulatory Disability
Demographics Similar to Immigrants from Congo by Ambulatory Disability
In terms of ambulatory disability, the demographic groups most similar to Immigrants from Congo are Immigrants from Ukraine (6.2%, a difference of 0.010%), Slovene (6.2%, a difference of 0.020%), Finnish (6.2%, a difference of 0.090%), Albanian (6.2%, a difference of 0.13%), and Immigrants from Central America (6.2%, a difference of 0.15%).
| Demographics | Rating | Rank | Ambulatory Disability |
| Poles | 26.3 /100 | #197 | Fair 6.2% |
| Immigrants | Bangladesh | 24.6 /100 | #198 | Fair 6.2% |
| Italians | 22.6 /100 | #199 | Fair 6.2% |
| Immigrants | Cambodia | 21.5 /100 | #200 | Fair 6.2% |
| Immigrants | Central America | 20.1 /100 | #201 | Fair 6.2% |
| Albanians | 19.7 /100 | #202 | Poor 6.2% |
| Immigrants | Ukraine | 18.4 /100 | #203 | Poor 6.2% |
| Immigrants | Congo | 18.2 /100 | #204 | Poor 6.2% |
| Slovenes | 18.0 /100 | #205 | Poor 6.2% |
| Finns | 17.2 /100 | #206 | Poor 6.2% |
| Alsatians | 15.1 /100 | #207 | Poor 6.3% |
| Bangladeshis | 14.2 /100 | #208 | Poor 6.3% |
| Immigrants | Iraq | 14.0 /100 | #209 | Poor 6.3% |
| Immigrants | Laos | 13.2 /100 | #210 | Poor 6.3% |
| Samoans | 12.1 /100 | #211 | Poor 6.3% |
Demographics Similar to Icelanders by Ambulatory Disability
In terms of ambulatory disability, the demographic groups most similar to Icelanders are Costa Rican (5.9%, a difference of 0.0%), Immigrants from Russia (5.9%, a difference of 0.020%), Immigrants from Middle Africa (5.9%, a difference of 0.060%), Estonian (5.9%, a difference of 0.070%), and Norwegian (5.9%, a difference of 0.11%).
| Demographics | Rating | Rank | Ambulatory Disability |
| South American Indians | 94.8 /100 | #115 | Exceptional 5.9% |
| Immigrants | Africa | 94.7 /100 | #116 | Exceptional 5.9% |
| Immigrants | South Eastern Asia | 93.6 /100 | #117 | Exceptional 5.9% |
| Russians | 93.4 /100 | #118 | Exceptional 5.9% |
| Norwegians | 93.1 /100 | #119 | Exceptional 5.9% |
| Estonians | 92.9 /100 | #120 | Exceptional 5.9% |
| Costa Ricans | 92.6 /100 | #121 | Exceptional 5.9% |
| Icelanders | 92.6 /100 | #122 | Exceptional 5.9% |
| Immigrants | Russia | 92.4 /100 | #123 | Exceptional 5.9% |
| Immigrants | Middle Africa | 92.2 /100 | #124 | Exceptional 5.9% |
| Koreans | 91.6 /100 | #125 | Exceptional 5.9% |
| Arabs | 91.5 /100 | #126 | Exceptional 5.9% |
| Immigrants | Nigeria | 90.9 /100 | #127 | Exceptional 5.9% |
| Immigrants | Western Asia | 90.7 /100 | #128 | Exceptional 5.9% |
| Immigrants | Norway | 90.5 /100 | #129 | Exceptional 5.9% |