Immigrants from Congo vs Puerto Rican 3rd Grade
COMPARE
Immigrants from Congo
Puerto Rican
3rd Grade
3rd Grade Comparison
Immigrants from Congo
Puerto Ricans
97.3%
3RD GRADE
0.6/ 100
METRIC RATING
256th/ 347
METRIC RANK
97.2%
3RD GRADE
0.2/ 100
METRIC RATING
271st/ 347
METRIC RANK
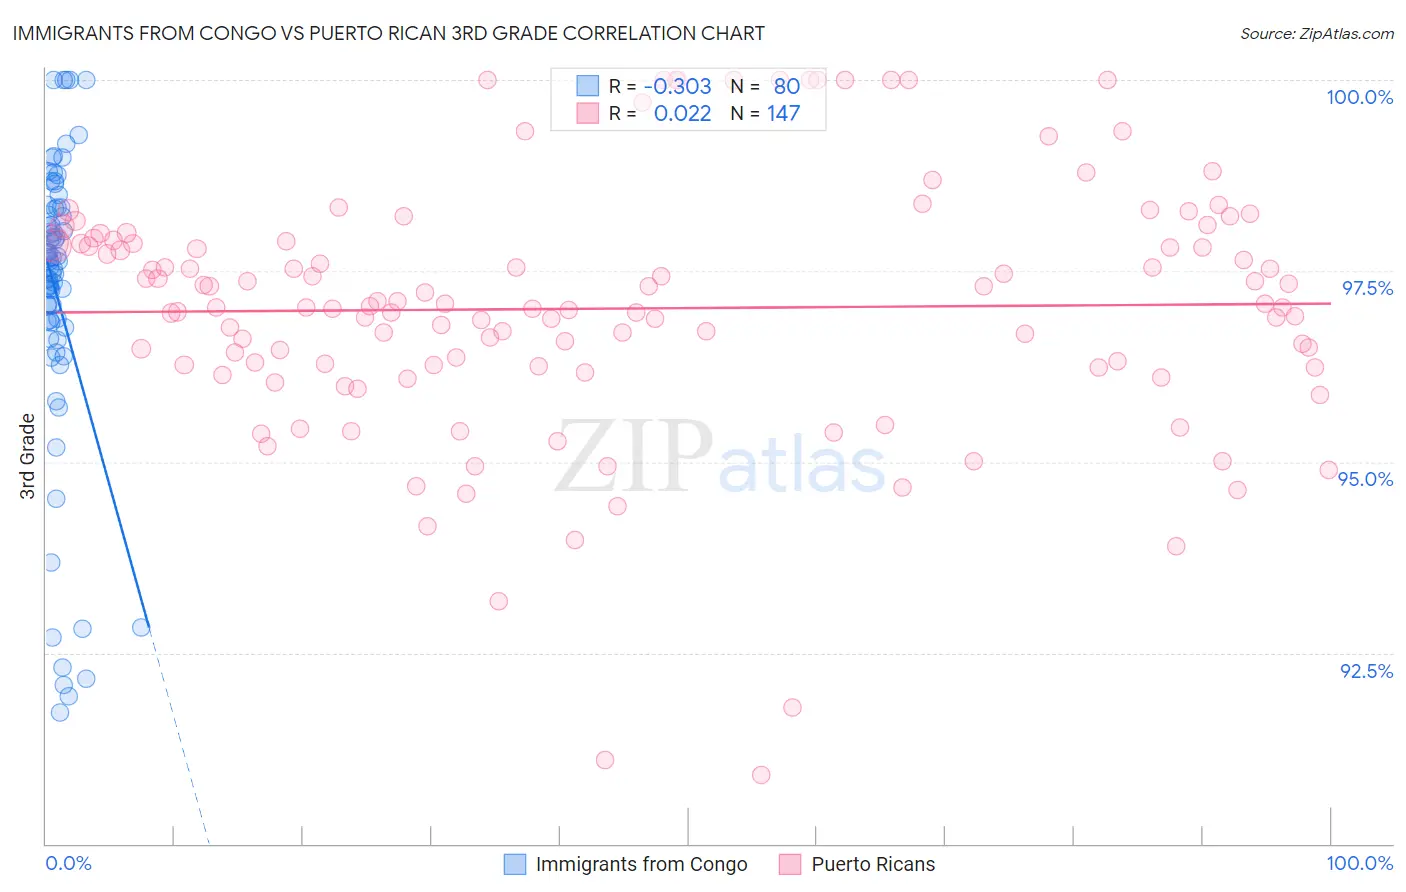
Immigrants from Congo vs Puerto Rican 3rd Grade Correlation Chart
The statistical analysis conducted on geographies consisting of 92,124,753 people shows a mild negative correlation between the proportion of Immigrants from Congo and percentage of population with at least 3rd grade education in the United States with a correlation coefficient (R) of -0.303 and weighted average of 97.3%. Similarly, the statistical analysis conducted on geographies consisting of 528,320,438 people shows no correlation between the proportion of Puerto Ricans and percentage of population with at least 3rd grade education in the United States with a correlation coefficient (R) of 0.022 and weighted average of 97.2%, a difference of 0.11%.
3rd Grade Correlation Summary
| Measurement | Immigrants from Congo | Puerto Rican |
| Minimum | 91.7% | 90.9% |
| Maximum | 100.0% | 100.0% |
| Range | 8.3% | 9.1% |
| Mean | 97.2% | 97.0% |
| Median | 97.6% | 97.0% |
| Interquartile 25% (IQ1) | 96.8% | 96.3% |
| Interquartile 75% (IQ3) | 98.3% | 97.9% |
| Interquartile Range (IQR) | 1.5% | 1.6% |
| Standard Deviation (Sample) | 2.0% | 1.7% |
| Standard Deviation (Population) | 2.0% | 1.7% |
Demographics Similar to Immigrants from Congo and Puerto Ricans by 3rd Grade
In terms of 3rd grade, the demographic groups most similar to Immigrants from Congo are Bolivian (97.3%, a difference of 0.0%), Immigrants from Colombia (97.3%, a difference of 0.010%), Jamaican (97.4%, a difference of 0.020%), Immigrants from Liberia (97.3%, a difference of 0.020%), and Armenian (97.3%, a difference of 0.020%). Similarly, the demographic groups most similar to Puerto Ricans are Ghanaian (97.2%, a difference of 0.0%), Immigrants from Peru (97.2%, a difference of 0.0%), Immigrants from China (97.2%, a difference of 0.010%), Yaqui (97.3%, a difference of 0.040%), and Immigrants from Nigeria (97.3%, a difference of 0.040%).
| Demographics | Rating | Rank | 3rd Grade |
| Immigrants | Africa | 0.8 /100 | #253 | Tragic 97.4% |
| Jamaicans | 0.7 /100 | #254 | Tragic 97.4% |
| Bolivians | 0.6 /100 | #255 | Tragic 97.3% |
| Immigrants | Congo | 0.6 /100 | #256 | Tragic 97.3% |
| Immigrants | Colombia | 0.5 /100 | #257 | Tragic 97.3% |
| Immigrants | Liberia | 0.5 /100 | #258 | Tragic 97.3% |
| Armenians | 0.4 /100 | #259 | Tragic 97.3% |
| Immigrants | Ethiopia | 0.4 /100 | #260 | Tragic 97.3% |
| Immigrants | South America | 0.4 /100 | #261 | Tragic 97.3% |
| Immigrants | Sierra Leone | 0.4 /100 | #262 | Tragic 97.3% |
| Taiwanese | 0.3 /100 | #263 | Tragic 97.3% |
| West Indians | 0.3 /100 | #264 | Tragic 97.3% |
| Immigrants | Jamaica | 0.3 /100 | #265 | Tragic 97.3% |
| Yaqui | 0.3 /100 | #266 | Tragic 97.3% |
| Immigrants | Nigeria | 0.3 /100 | #267 | Tragic 97.3% |
| Cubans | 0.2 /100 | #268 | Tragic 97.3% |
| Fijians | 0.2 /100 | #269 | Tragic 97.3% |
| Immigrants | China | 0.2 /100 | #270 | Tragic 97.2% |
| Puerto Ricans | 0.2 /100 | #271 | Tragic 97.2% |
| Ghanaians | 0.1 /100 | #272 | Tragic 97.2% |
| Immigrants | Peru | 0.1 /100 | #273 | Tragic 97.2% |