Immigrants from India vs Puerto Rican Ambulatory Disability
COMPARE
Immigrants from India
Puerto Rican
Ambulatory Disability
Ambulatory Disability Comparison
Immigrants from India
Puerto Ricans
4.8%
AMBULATORY DISABILITY
100.0/ 100
METRIC RATING
1st/ 347
METRIC RANK
8.9%
AMBULATORY DISABILITY
0.0/ 100
METRIC RATING
345th/ 347
METRIC RANK
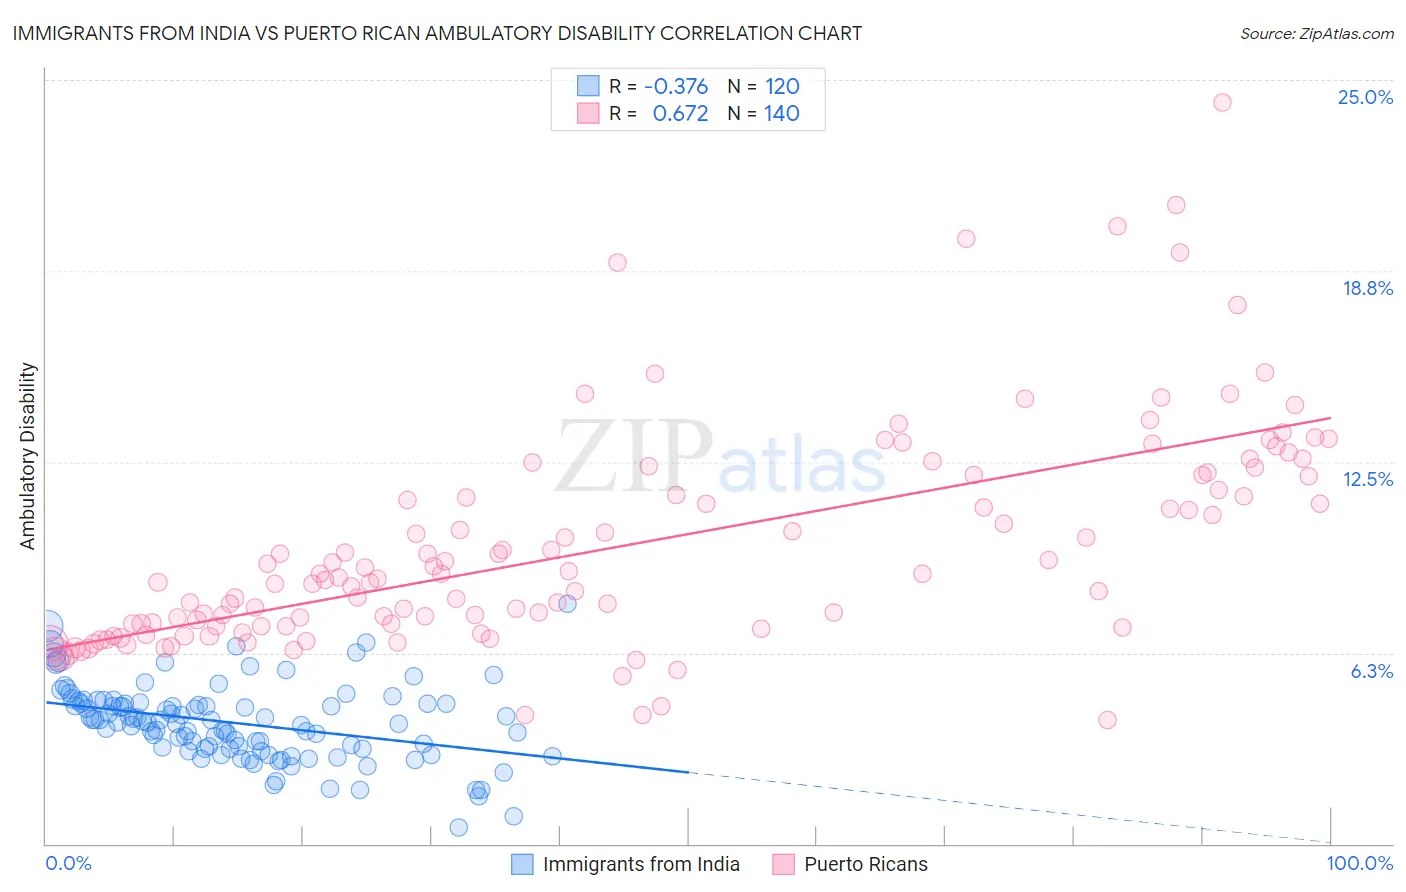
Immigrants from India vs Puerto Rican Ambulatory Disability Correlation Chart
The statistical analysis conducted on geographies consisting of 433,949,483 people shows a mild negative correlation between the proportion of Immigrants from India and percentage of population with ambulatory disability in the United States with a correlation coefficient (R) of -0.376 and weighted average of 4.8%. Similarly, the statistical analysis conducted on geographies consisting of 527,889,782 people shows a significant positive correlation between the proportion of Puerto Ricans and percentage of population with ambulatory disability in the United States with a correlation coefficient (R) of 0.672 and weighted average of 8.9%, a difference of 86.0%.
Ambulatory Disability Correlation Summary
| Measurement | Immigrants from India | Puerto Rican |
| Minimum | 0.54% | 4.0% |
| Maximum | 7.8% | 24.3% |
| Range | 7.3% | 20.2% |
| Mean | 4.0% | 9.7% |
| Median | 4.0% | 8.7% |
| Interquartile 25% (IQ1) | 3.1% | 7.1% |
| Interquartile 75% (IQ3) | 4.6% | 11.8% |
| Interquartile Range (IQR) | 1.5% | 4.7% |
| Standard Deviation (Sample) | 1.3% | 3.6% |
| Standard Deviation (Population) | 1.2% | 3.6% |
Similar Demographics by Ambulatory Disability
Demographics Similar to Immigrants from India by Ambulatory Disability
In terms of ambulatory disability, the demographic groups most similar to Immigrants from India are Filipino (4.9%, a difference of 2.0%), Thai (4.9%, a difference of 3.2%), Immigrants from Taiwan (4.9%, a difference of 3.5%), Immigrants from Singapore (5.0%, a difference of 4.9%), and Immigrants from Bolivia (5.0%, a difference of 5.7%).
| Demographics | Rating | Rank | Ambulatory Disability |
| Immigrants | India | 100.0 /100 | #1 | Exceptional 4.8% |
| Filipinos | 100.0 /100 | #2 | Exceptional 4.9% |
| Thais | 100.0 /100 | #3 | Exceptional 4.9% |
| Immigrants | Taiwan | 100.0 /100 | #4 | Exceptional 4.9% |
| Immigrants | Singapore | 100.0 /100 | #5 | Exceptional 5.0% |
| Immigrants | Bolivia | 100.0 /100 | #6 | Exceptional 5.0% |
| Bolivians | 100.0 /100 | #7 | Exceptional 5.1% |
| Immigrants | South Central Asia | 100.0 /100 | #8 | Exceptional 5.1% |
| Iranians | 100.0 /100 | #9 | Exceptional 5.1% |
| Yup'ik | 100.0 /100 | #10 | Exceptional 5.2% |
| Immigrants | Korea | 100.0 /100 | #11 | Exceptional 5.2% |
| Okinawans | 100.0 /100 | #12 | Exceptional 5.3% |
| Burmese | 100.0 /100 | #13 | Exceptional 5.3% |
| Immigrants | Eastern Asia | 100.0 /100 | #14 | Exceptional 5.3% |
| Immigrants | China | 100.0 /100 | #15 | Exceptional 5.3% |
Demographics Similar to Puerto Ricans by Ambulatory Disability
In terms of ambulatory disability, the demographic groups most similar to Puerto Ricans are Tsimshian (8.8%, a difference of 0.59%), Tohono O'odham (8.7%, a difference of 1.6%), Kiowa (8.6%, a difference of 3.1%), Houma (9.3%, a difference of 4.9%), and Creek (8.5%, a difference of 5.0%).
| Demographics | Rating | Rank | Ambulatory Disability |
| Cherokee | 0.0 /100 | #333 | Tragic 7.9% |
| Yuman | 0.0 /100 | #334 | Tragic 7.9% |
| Chickasaw | 0.0 /100 | #335 | Tragic 8.0% |
| Seminole | 0.0 /100 | #336 | Tragic 8.0% |
| Dutch West Indians | 0.0 /100 | #337 | Tragic 8.2% |
| Colville | 0.0 /100 | #338 | Tragic 8.2% |
| Pima | 0.0 /100 | #339 | Tragic 8.2% |
| Choctaw | 0.0 /100 | #340 | Tragic 8.3% |
| Creek | 0.0 /100 | #341 | Tragic 8.5% |
| Kiowa | 0.0 /100 | #342 | Tragic 8.6% |
| Tohono O'odham | 0.0 /100 | #343 | Tragic 8.7% |
| Tsimshian | 0.0 /100 | #344 | Tragic 8.8% |
| Puerto Ricans | 0.0 /100 | #345 | Tragic 8.9% |
| Houma | 0.0 /100 | #346 | Tragic 9.3% |
| Lumbee | 0.0 /100 | #347 | Tragic 9.5% |