Immigrants from Congo vs Uruguayan Ambulatory Disability
COMPARE
Immigrants from Congo
Uruguayan
Ambulatory Disability
Ambulatory Disability Comparison
Immigrants from Congo
Uruguayans
6.2%
AMBULATORY DISABILITY
18.2/ 100
METRIC RATING
204th/ 347
METRIC RANK
5.8%
AMBULATORY DISABILITY
97.2/ 100
METRIC RATING
107th/ 347
METRIC RANK
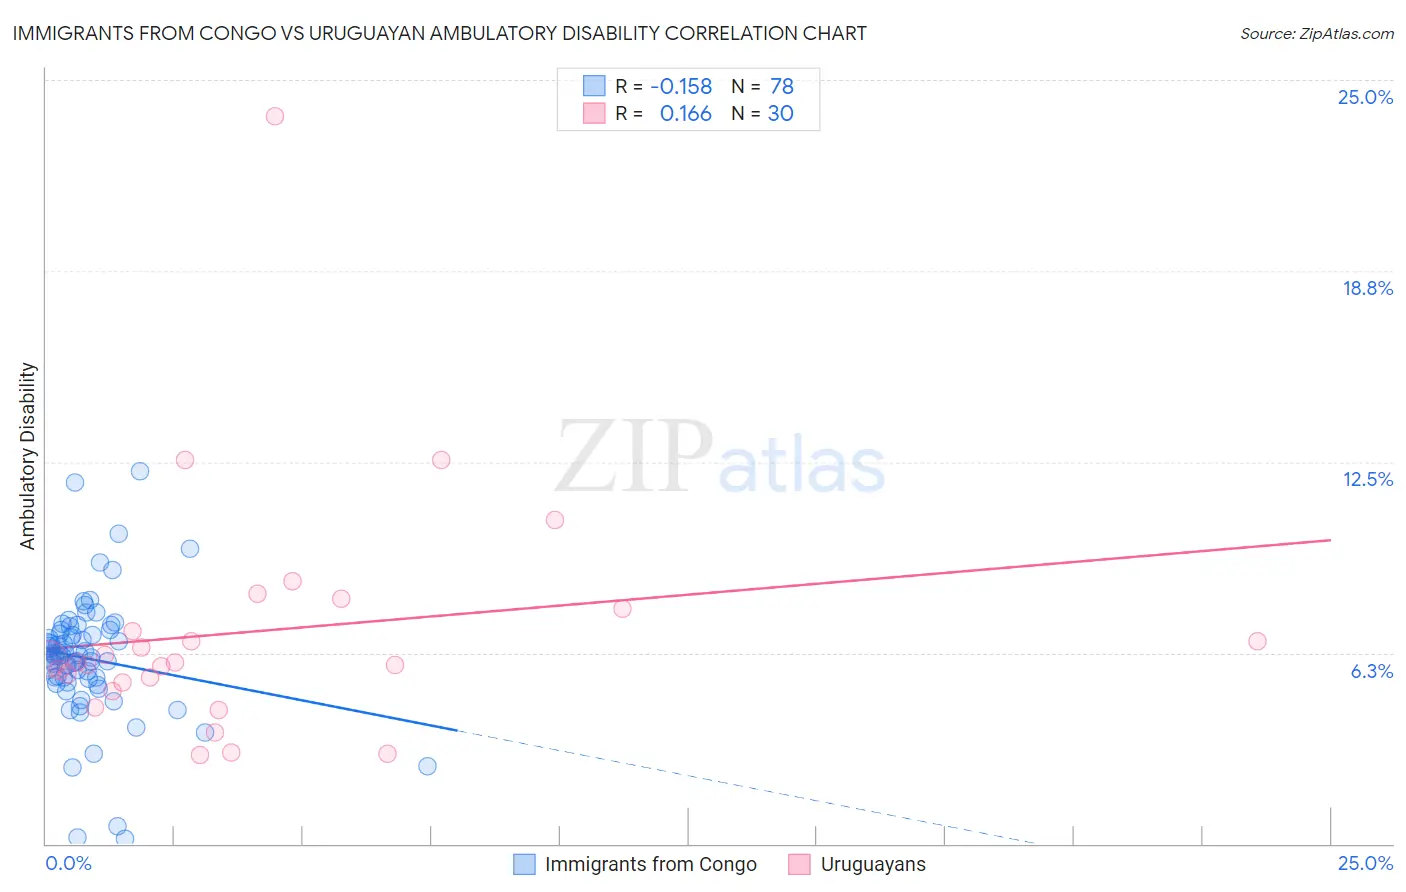
Immigrants from Congo vs Uruguayan Ambulatory Disability Correlation Chart
The statistical analysis conducted on geographies consisting of 92,115,389 people shows a poor negative correlation between the proportion of Immigrants from Congo and percentage of population with ambulatory disability in the United States with a correlation coefficient (R) of -0.158 and weighted average of 6.2%. Similarly, the statistical analysis conducted on geographies consisting of 144,780,979 people shows a poor positive correlation between the proportion of Uruguayans and percentage of population with ambulatory disability in the United States with a correlation coefficient (R) of 0.166 and weighted average of 5.8%, a difference of 7.0%.
Ambulatory Disability Correlation Summary
| Measurement | Immigrants from Congo | Uruguayan |
| Minimum | 0.17% | 2.9% |
| Maximum | 12.2% | 23.8% |
| Range | 12.0% | 20.9% |
| Mean | 6.1% | 6.9% |
| Median | 6.1% | 5.9% |
| Interquartile 25% (IQ1) | 5.4% | 5.3% |
| Interquartile 75% (IQ3) | 6.9% | 7.7% |
| Interquartile Range (IQR) | 1.5% | 2.4% |
| Standard Deviation (Sample) | 2.0% | 4.0% |
| Standard Deviation (Population) | 2.0% | 3.9% |
Similar Demographics by Ambulatory Disability
Demographics Similar to Immigrants from Congo by Ambulatory Disability
In terms of ambulatory disability, the demographic groups most similar to Immigrants from Congo are Immigrants from Ukraine (6.2%, a difference of 0.010%), Slovene (6.2%, a difference of 0.020%), Finnish (6.2%, a difference of 0.090%), Albanian (6.2%, a difference of 0.13%), and Immigrants from Central America (6.2%, a difference of 0.15%).
| Demographics | Rating | Rank | Ambulatory Disability |
| Poles | 26.3 /100 | #197 | Fair 6.2% |
| Immigrants | Bangladesh | 24.6 /100 | #198 | Fair 6.2% |
| Italians | 22.6 /100 | #199 | Fair 6.2% |
| Immigrants | Cambodia | 21.5 /100 | #200 | Fair 6.2% |
| Immigrants | Central America | 20.1 /100 | #201 | Fair 6.2% |
| Albanians | 19.7 /100 | #202 | Poor 6.2% |
| Immigrants | Ukraine | 18.4 /100 | #203 | Poor 6.2% |
| Immigrants | Congo | 18.2 /100 | #204 | Poor 6.2% |
| Slovenes | 18.0 /100 | #205 | Poor 6.2% |
| Finns | 17.2 /100 | #206 | Poor 6.2% |
| Alsatians | 15.1 /100 | #207 | Poor 6.3% |
| Bangladeshis | 14.2 /100 | #208 | Poor 6.3% |
| Immigrants | Iraq | 14.0 /100 | #209 | Poor 6.3% |
| Immigrants | Laos | 13.2 /100 | #210 | Poor 6.3% |
| Samoans | 12.1 /100 | #211 | Poor 6.3% |
Demographics Similar to Uruguayans by Ambulatory Disability
In terms of ambulatory disability, the demographic groups most similar to Uruguayans are Colombian (5.8%, a difference of 0.010%), Immigrants from Netherlands (5.8%, a difference of 0.030%), Immigrants from Morocco (5.8%, a difference of 0.050%), Immigrants from Czechoslovakia (5.8%, a difference of 0.12%), and Immigrants from Colombia (5.8%, a difference of 0.21%).
| Demographics | Rating | Rank | Ambulatory Disability |
| Immigrants | Serbia | 97.9 /100 | #100 | Exceptional 5.8% |
| Immigrants | South America | 97.9 /100 | #101 | Exceptional 5.8% |
| Immigrants | Kenya | 97.8 /100 | #102 | Exceptional 5.8% |
| Immigrants | Romania | 97.7 /100 | #103 | Exceptional 5.8% |
| New Zealanders | 97.6 /100 | #104 | Exceptional 5.8% |
| Immigrants | Czechoslovakia | 97.4 /100 | #105 | Exceptional 5.8% |
| Immigrants | Morocco | 97.3 /100 | #106 | Exceptional 5.8% |
| Uruguayans | 97.2 /100 | #107 | Exceptional 5.8% |
| Colombians | 97.2 /100 | #108 | Exceptional 5.8% |
| Immigrants | Netherlands | 97.1 /100 | #109 | Exceptional 5.8% |
| Immigrants | Colombia | 96.7 /100 | #110 | Exceptional 5.8% |
| Danes | 96.6 /100 | #111 | Exceptional 5.8% |
| South Africans | 96.3 /100 | #112 | Exceptional 5.9% |
| Immigrants | Uruguay | 95.6 /100 | #113 | Exceptional 5.9% |
| Immigrants | Poland | 95.4 /100 | #114 | Exceptional 5.9% |