Immigrants from Congo vs Immigrants from Middle Africa Disability Age 5 to 17
COMPARE
Immigrants from Congo
Immigrants from Middle Africa
Disability Age 5 to 17
Disability Age 5 to 17 Comparison
Immigrants from Congo
Immigrants from Middle Africa
6.2%
DISABILITY AGE 5 TO 17
0.0/ 100
METRIC RATING
290th/ 347
METRIC RANK
5.9%
DISABILITY AGE 5 TO 17
0.7/ 100
METRIC RATING
261st/ 347
METRIC RANK
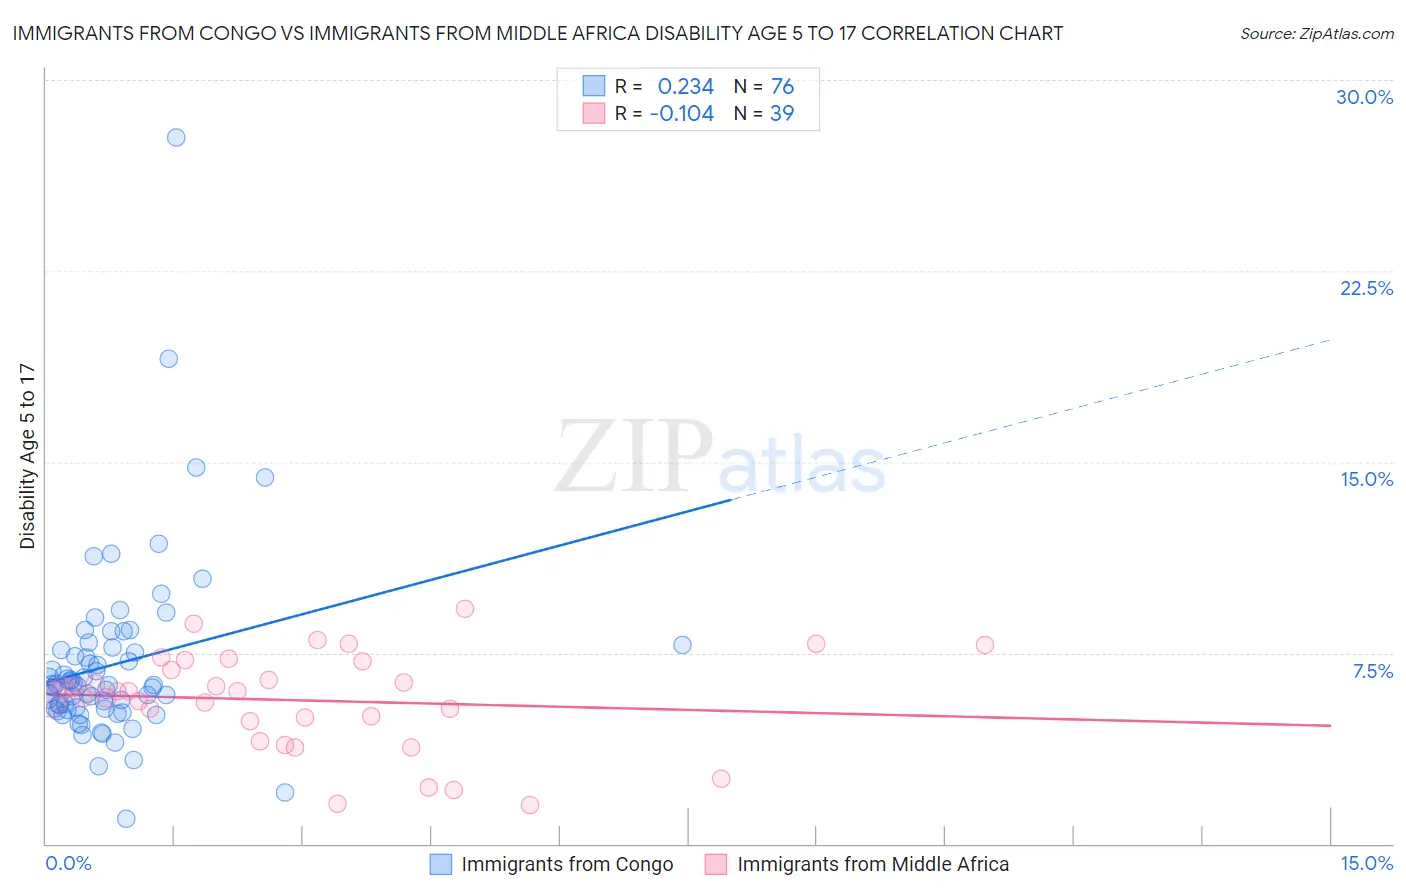
Immigrants from Congo vs Immigrants from Middle Africa Disability Age 5 to 17 Correlation Chart
The statistical analysis conducted on geographies consisting of 91,997,133 people shows a weak positive correlation between the proportion of Immigrants from Congo and percentage of population with a disability between the ages 5 and 17 in the United States with a correlation coefficient (R) of 0.234 and weighted average of 6.2%. Similarly, the statistical analysis conducted on geographies consisting of 202,029,943 people shows a poor negative correlation between the proportion of Immigrants from Middle Africa and percentage of population with a disability between the ages 5 and 17 in the United States with a correlation coefficient (R) of -0.104 and weighted average of 5.9%, a difference of 4.3%.
Disability Age 5 to 17 Correlation Summary
| Measurement | Immigrants from Congo | Immigrants from Middle Africa |
| Minimum | 0.97% | 1.5% |
| Maximum | 27.7% | 9.2% |
| Range | 26.7% | 7.7% |
| Mean | 7.0% | 5.6% |
| Median | 6.2% | 6.0% |
| Interquartile 25% (IQ1) | 5.3% | 4.8% |
| Interquartile 75% (IQ3) | 7.7% | 7.2% |
| Interquartile Range (IQR) | 2.3% | 2.4% |
| Standard Deviation (Sample) | 3.6% | 1.9% |
| Standard Deviation (Population) | 3.6% | 1.9% |
Similar Demographics by Disability Age 5 to 17
Demographics Similar to Immigrants from Congo by Disability Age 5 to 17
In terms of disability age 5 to 17, the demographic groups most similar to Immigrants from Congo are Yaqui (6.2%, a difference of 0.0%), Jamaican (6.2%, a difference of 0.010%), White/Caucasian (6.2%, a difference of 0.15%), Pima (6.2%, a difference of 0.27%), and Immigrants from Senegal (6.2%, a difference of 0.39%).
| Demographics | Rating | Rank | Disability Age 5 to 17 |
| Ugandans | 0.0 /100 | #283 | Tragic 6.2% |
| Sub-Saharan Africans | 0.0 /100 | #284 | Tragic 6.2% |
| English | 0.0 /100 | #285 | Tragic 6.2% |
| Colville | 0.0 /100 | #286 | Tragic 6.2% |
| Pima | 0.0 /100 | #287 | Tragic 6.2% |
| Jamaicans | 0.0 /100 | #288 | Tragic 6.2% |
| Yaqui | 0.0 /100 | #289 | Tragic 6.2% |
| Immigrants | Congo | 0.0 /100 | #290 | Tragic 6.2% |
| Whites/Caucasians | 0.0 /100 | #291 | Tragic 6.2% |
| Immigrants | Senegal | 0.0 /100 | #292 | Tragic 6.2% |
| Central American Indians | 0.0 /100 | #293 | Tragic 6.2% |
| Irish | 0.0 /100 | #294 | Tragic 6.2% |
| Cree | 0.0 /100 | #295 | Tragic 6.2% |
| Spanish Americans | 0.0 /100 | #296 | Tragic 6.2% |
| Immigrants | Bahamas | 0.0 /100 | #297 | Tragic 6.2% |
Demographics Similar to Immigrants from Middle Africa by Disability Age 5 to 17
In terms of disability age 5 to 17, the demographic groups most similar to Immigrants from Middle Africa are Immigrants from Western Africa (5.9%, a difference of 0.030%), Somali (5.9%, a difference of 0.070%), Czechoslovakian (5.9%, a difference of 0.11%), Slavic (5.9%, a difference of 0.20%), and Canadian (6.0%, a difference of 0.23%).
| Demographics | Rating | Rank | Disability Age 5 to 17 |
| Barbadians | 1.3 /100 | #254 | Tragic 5.9% |
| Italians | 1.2 /100 | #255 | Tragic 5.9% |
| Hopi | 1.0 /100 | #256 | Tragic 5.9% |
| Hispanics or Latinos | 1.0 /100 | #257 | Tragic 5.9% |
| Brazilians | 0.9 /100 | #258 | Tragic 5.9% |
| Slavs | 0.9 /100 | #259 | Tragic 5.9% |
| Somalis | 0.8 /100 | #260 | Tragic 5.9% |
| Immigrants | Middle Africa | 0.7 /100 | #261 | Tragic 5.9% |
| Immigrants | Western Africa | 0.7 /100 | #262 | Tragic 5.9% |
| Czechoslovakians | 0.7 /100 | #263 | Tragic 5.9% |
| Canadians | 0.6 /100 | #264 | Tragic 6.0% |
| Panamanians | 0.6 /100 | #265 | Tragic 6.0% |
| Slovenes | 0.6 /100 | #266 | Tragic 6.0% |
| Spanish | 0.5 /100 | #267 | Tragic 6.0% |
| Sioux | 0.4 /100 | #268 | Tragic 6.0% |