German vs Immigrants from Middle Africa Disability Age 5 to 17
COMPARE
German
Immigrants from Middle Africa
Disability Age 5 to 17
Disability Age 5 to 17 Comparison
Germans
Immigrants from Middle Africa
6.1%
DISABILITY AGE 5 TO 17
0.0/ 100
METRIC RATING
282nd/ 347
METRIC RANK
5.9%
DISABILITY AGE 5 TO 17
0.7/ 100
METRIC RATING
261st/ 347
METRIC RANK
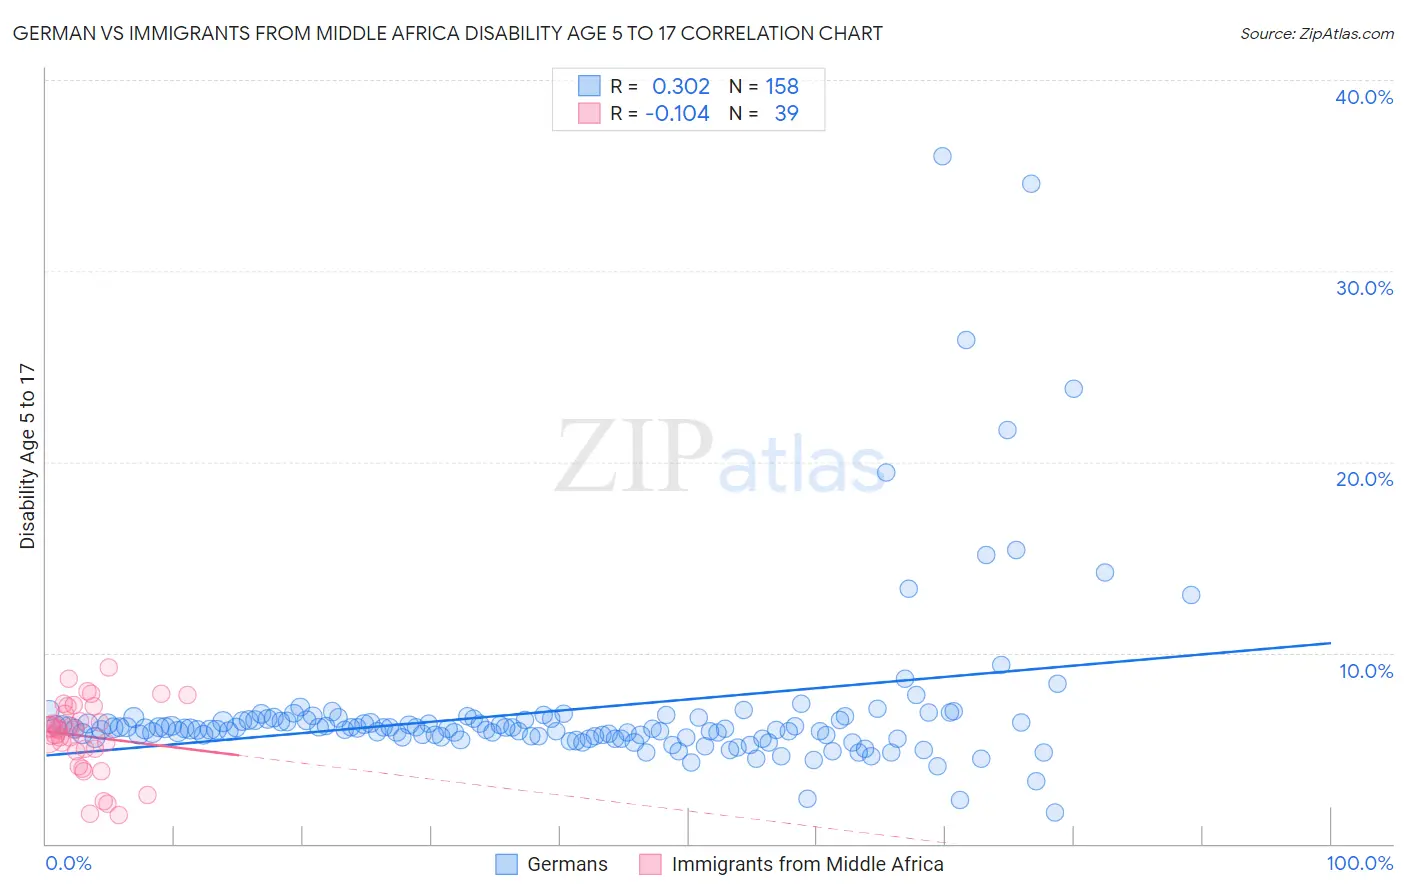
German vs Immigrants from Middle Africa Disability Age 5 to 17 Correlation Chart
The statistical analysis conducted on geographies consisting of 564,502,598 people shows a mild positive correlation between the proportion of Germans and percentage of population with a disability between the ages 5 and 17 in the United States with a correlation coefficient (R) of 0.302 and weighted average of 6.1%. Similarly, the statistical analysis conducted on geographies consisting of 202,029,943 people shows a poor negative correlation between the proportion of Immigrants from Middle Africa and percentage of population with a disability between the ages 5 and 17 in the United States with a correlation coefficient (R) of -0.104 and weighted average of 5.9%, a difference of 3.5%.
Disability Age 5 to 17 Correlation Summary
| Measurement | German | Immigrants from Middle Africa |
| Minimum | 1.7% | 1.5% |
| Maximum | 36.0% | 9.2% |
| Range | 34.3% | 7.7% |
| Mean | 7.0% | 5.6% |
| Median | 6.0% | 6.0% |
| Interquartile 25% (IQ1) | 5.6% | 4.8% |
| Interquartile 75% (IQ3) | 6.5% | 7.2% |
| Interquartile Range (IQR) | 0.88% | 2.4% |
| Standard Deviation (Sample) | 4.5% | 1.9% |
| Standard Deviation (Population) | 4.5% | 1.9% |
Similar Demographics by Disability Age 5 to 17
Demographics Similar to Germans by Disability Age 5 to 17
In terms of disability age 5 to 17, the demographic groups most similar to Germans are Ugandan (6.2%, a difference of 0.16%), Subsaharan African (6.2%, a difference of 0.19%), English (6.2%, a difference of 0.19%), Colville (6.2%, a difference of 0.23%), and Scottish (6.1%, a difference of 0.25%).
| Demographics | Rating | Rank | Disability Age 5 to 17 |
| Dutch | 0.2 /100 | #275 | Tragic 6.0% |
| Japanese | 0.1 /100 | #276 | Tragic 6.1% |
| Puget Sound Salish | 0.1 /100 | #277 | Tragic 6.1% |
| Immigrants | Liberia | 0.1 /100 | #278 | Tragic 6.1% |
| Immigrants | Jamaica | 0.1 /100 | #279 | Tragic 6.1% |
| Portuguese | 0.1 /100 | #280 | Tragic 6.1% |
| Scottish | 0.0 /100 | #281 | Tragic 6.1% |
| Germans | 0.0 /100 | #282 | Tragic 6.1% |
| Ugandans | 0.0 /100 | #283 | Tragic 6.2% |
| Sub-Saharan Africans | 0.0 /100 | #284 | Tragic 6.2% |
| English | 0.0 /100 | #285 | Tragic 6.2% |
| Colville | 0.0 /100 | #286 | Tragic 6.2% |
| Pima | 0.0 /100 | #287 | Tragic 6.2% |
| Jamaicans | 0.0 /100 | #288 | Tragic 6.2% |
| Yaqui | 0.0 /100 | #289 | Tragic 6.2% |
Demographics Similar to Immigrants from Middle Africa by Disability Age 5 to 17
In terms of disability age 5 to 17, the demographic groups most similar to Immigrants from Middle Africa are Immigrants from Western Africa (5.9%, a difference of 0.030%), Somali (5.9%, a difference of 0.070%), Czechoslovakian (5.9%, a difference of 0.11%), Slavic (5.9%, a difference of 0.20%), and Canadian (6.0%, a difference of 0.23%).
| Demographics | Rating | Rank | Disability Age 5 to 17 |
| Barbadians | 1.3 /100 | #254 | Tragic 5.9% |
| Italians | 1.2 /100 | #255 | Tragic 5.9% |
| Hopi | 1.0 /100 | #256 | Tragic 5.9% |
| Hispanics or Latinos | 1.0 /100 | #257 | Tragic 5.9% |
| Brazilians | 0.9 /100 | #258 | Tragic 5.9% |
| Slavs | 0.9 /100 | #259 | Tragic 5.9% |
| Somalis | 0.8 /100 | #260 | Tragic 5.9% |
| Immigrants | Middle Africa | 0.7 /100 | #261 | Tragic 5.9% |
| Immigrants | Western Africa | 0.7 /100 | #262 | Tragic 5.9% |
| Czechoslovakians | 0.7 /100 | #263 | Tragic 5.9% |
| Canadians | 0.6 /100 | #264 | Tragic 6.0% |
| Panamanians | 0.6 /100 | #265 | Tragic 6.0% |
| Slovenes | 0.6 /100 | #266 | Tragic 6.0% |
| Spanish | 0.5 /100 | #267 | Tragic 6.0% |
| Sioux | 0.4 /100 | #268 | Tragic 6.0% |