Chilean vs Immigrants from Middle Africa Disability Age 5 to 17
COMPARE
Chilean
Immigrants from Middle Africa
Disability Age 5 to 17
Disability Age 5 to 17 Comparison
Chileans
Immigrants from Middle Africa
5.4%
DISABILITY AGE 5 TO 17
95.8/ 100
METRIC RATING
122nd/ 347
METRIC RANK
5.9%
DISABILITY AGE 5 TO 17
0.7/ 100
METRIC RATING
261st/ 347
METRIC RANK
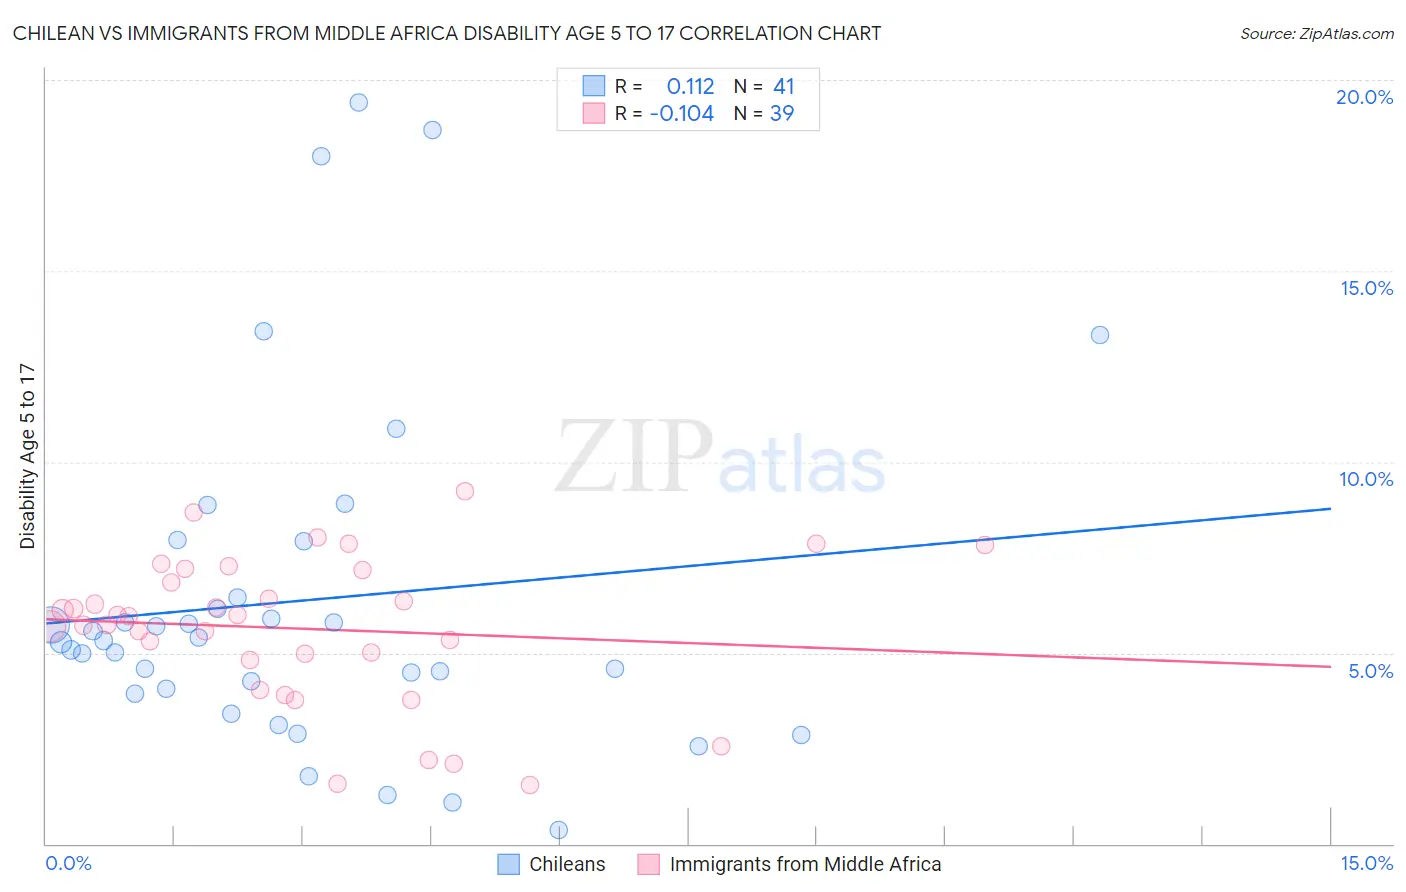
Chilean vs Immigrants from Middle Africa Disability Age 5 to 17 Correlation Chart
The statistical analysis conducted on geographies consisting of 255,519,515 people shows a poor positive correlation between the proportion of Chileans and percentage of population with a disability between the ages 5 and 17 in the United States with a correlation coefficient (R) of 0.112 and weighted average of 5.4%. Similarly, the statistical analysis conducted on geographies consisting of 202,029,943 people shows a poor negative correlation between the proportion of Immigrants from Middle Africa and percentage of population with a disability between the ages 5 and 17 in the United States with a correlation coefficient (R) of -0.104 and weighted average of 5.9%, a difference of 10.3%.
Disability Age 5 to 17 Correlation Summary
| Measurement | Chilean | Immigrants from Middle Africa |
| Minimum | 0.37% | 1.5% |
| Maximum | 19.4% | 9.2% |
| Range | 19.1% | 7.7% |
| Mean | 6.4% | 5.6% |
| Median | 5.3% | 6.0% |
| Interquartile 25% (IQ1) | 4.0% | 4.8% |
| Interquartile 75% (IQ3) | 7.2% | 7.2% |
| Interquartile Range (IQR) | 3.2% | 2.4% |
| Standard Deviation (Sample) | 4.5% | 1.9% |
| Standard Deviation (Population) | 4.4% | 1.9% |
Similar Demographics by Disability Age 5 to 17
Demographics Similar to Chileans by Disability Age 5 to 17
In terms of disability age 5 to 17, the demographic groups most similar to Chileans are Maltese (5.4%, a difference of 0.060%), Immigrants from Ethiopia (5.4%, a difference of 0.10%), Crow (5.4%, a difference of 0.23%), Immigrants from Chile (5.4%, a difference of 0.24%), and New Zealander (5.4%, a difference of 0.25%).
| Demographics | Rating | Rank | Disability Age 5 to 17 |
| Cubans | 97.8 /100 | #115 | Exceptional 5.3% |
| Cypriots | 97.7 /100 | #116 | Exceptional 5.3% |
| Immigrants | Afghanistan | 97.4 /100 | #117 | Exceptional 5.3% |
| South Americans | 97.1 /100 | #118 | Exceptional 5.4% |
| Immigrants | South America | 97.1 /100 | #119 | Exceptional 5.4% |
| Immigrants | Immigrants | 97.0 /100 | #120 | Exceptional 5.4% |
| Maltese | 96.0 /100 | #121 | Exceptional 5.4% |
| Chileans | 95.8 /100 | #122 | Exceptional 5.4% |
| Immigrants | Ethiopia | 95.5 /100 | #123 | Exceptional 5.4% |
| Crow | 95.0 /100 | #124 | Exceptional 5.4% |
| Immigrants | Chile | 95.0 /100 | #125 | Exceptional 5.4% |
| New Zealanders | 95.0 /100 | #126 | Exceptional 5.4% |
| Latvians | 95.0 /100 | #127 | Exceptional 5.4% |
| Immigrants | Venezuela | 94.5 /100 | #128 | Exceptional 5.4% |
| Romanians | 94.1 /100 | #129 | Exceptional 5.4% |
Demographics Similar to Immigrants from Middle Africa by Disability Age 5 to 17
In terms of disability age 5 to 17, the demographic groups most similar to Immigrants from Middle Africa are Immigrants from Western Africa (5.9%, a difference of 0.030%), Somali (5.9%, a difference of 0.070%), Czechoslovakian (5.9%, a difference of 0.11%), Slavic (5.9%, a difference of 0.20%), and Canadian (6.0%, a difference of 0.23%).
| Demographics | Rating | Rank | Disability Age 5 to 17 |
| Barbadians | 1.3 /100 | #254 | Tragic 5.9% |
| Italians | 1.2 /100 | #255 | Tragic 5.9% |
| Hopi | 1.0 /100 | #256 | Tragic 5.9% |
| Hispanics or Latinos | 1.0 /100 | #257 | Tragic 5.9% |
| Brazilians | 0.9 /100 | #258 | Tragic 5.9% |
| Slavs | 0.9 /100 | #259 | Tragic 5.9% |
| Somalis | 0.8 /100 | #260 | Tragic 5.9% |
| Immigrants | Middle Africa | 0.7 /100 | #261 | Tragic 5.9% |
| Immigrants | Western Africa | 0.7 /100 | #262 | Tragic 5.9% |
| Czechoslovakians | 0.7 /100 | #263 | Tragic 5.9% |
| Canadians | 0.6 /100 | #264 | Tragic 6.0% |
| Panamanians | 0.6 /100 | #265 | Tragic 6.0% |
| Slovenes | 0.6 /100 | #266 | Tragic 6.0% |
| Spanish | 0.5 /100 | #267 | Tragic 6.0% |
| Sioux | 0.4 /100 | #268 | Tragic 6.0% |