Immigrants from Congo vs Immigrants from Middle Africa 10th Grade
COMPARE
Immigrants from Congo
Immigrants from Middle Africa
10th Grade
10th Grade Comparison
Immigrants from Congo
Immigrants from Middle Africa
92.4%
10TH GRADE
0.2/ 100
METRIC RATING
274th/ 347
METRIC RANK
92.9%
10TH GRADE
1.7/ 100
METRIC RATING
246th/ 347
METRIC RANK
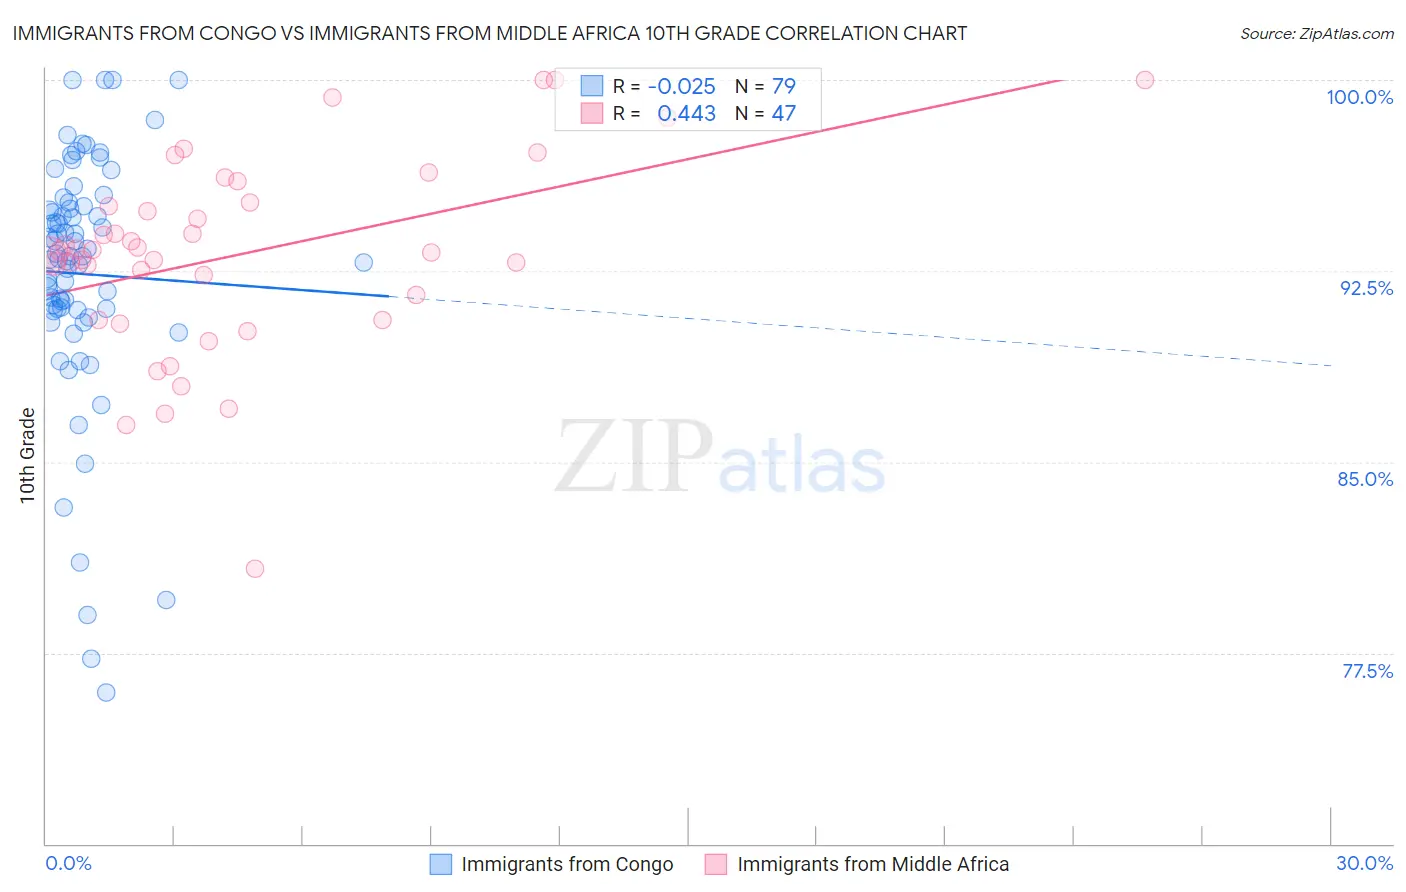
Immigrants from Congo vs Immigrants from Middle Africa 10th Grade Correlation Chart
The statistical analysis conducted on geographies consisting of 92,131,505 people shows no correlation between the proportion of Immigrants from Congo and percentage of population with at least 10th grade education in the United States with a correlation coefficient (R) of -0.025 and weighted average of 92.4%. Similarly, the statistical analysis conducted on geographies consisting of 202,726,551 people shows a moderate positive correlation between the proportion of Immigrants from Middle Africa and percentage of population with at least 10th grade education in the United States with a correlation coefficient (R) of 0.443 and weighted average of 92.9%, a difference of 0.48%.
10th Grade Correlation Summary
| Measurement | Immigrants from Congo | Immigrants from Middle Africa |
| Minimum | 75.9% | 80.8% |
| Maximum | 100.0% | 100.0% |
| Range | 24.1% | 19.2% |
| Mean | 92.4% | 93.1% |
| Median | 93.1% | 93.3% |
| Interquartile 25% (IQ1) | 91.0% | 90.6% |
| Interquartile 75% (IQ3) | 95.1% | 95.2% |
| Interquartile Range (IQR) | 4.1% | 4.6% |
| Standard Deviation (Sample) | 4.9% | 3.9% |
| Standard Deviation (Population) | 4.9% | 3.8% |
Similar Demographics by 10th Grade
Demographics Similar to Immigrants from Congo by 10th Grade
In terms of 10th grade, the demographic groups most similar to Immigrants from Congo are West Indian (92.4%, a difference of 0.0%), Trinidadian and Tobagonian (92.4%, a difference of 0.010%), Immigrants from Western Africa (92.5%, a difference of 0.080%), Immigrants from Eritrea (92.5%, a difference of 0.090%), and Immigrants from Colombia (92.5%, a difference of 0.10%).
| Demographics | Rating | Rank | 10th Grade |
| Taiwanese | 0.3 /100 | #267 | Tragic 92.5% |
| Immigrants | Ghana | 0.3 /100 | #268 | Tragic 92.5% |
| Immigrants | Colombia | 0.3 /100 | #269 | Tragic 92.5% |
| Immigrants | Uruguay | 0.3 /100 | #270 | Tragic 92.5% |
| Immigrants | Eritrea | 0.3 /100 | #271 | Tragic 92.5% |
| Immigrants | Western Africa | 0.3 /100 | #272 | Tragic 92.5% |
| Trinidadians and Tobagonians | 0.2 /100 | #273 | Tragic 92.4% |
| Immigrants | Congo | 0.2 /100 | #274 | Tragic 92.4% |
| West Indians | 0.2 /100 | #275 | Tragic 92.4% |
| Immigrants | Trinidad and Tobago | 0.1 /100 | #276 | Tragic 92.3% |
| Navajo | 0.1 /100 | #277 | Tragic 92.3% |
| Barbadians | 0.1 /100 | #278 | Tragic 92.2% |
| Natives/Alaskans | 0.1 /100 | #279 | Tragic 92.2% |
| Malaysians | 0.1 /100 | #280 | Tragic 92.2% |
| Bangladeshis | 0.1 /100 | #281 | Tragic 92.2% |
Demographics Similar to Immigrants from Middle Africa by 10th Grade
In terms of 10th grade, the demographic groups most similar to Immigrants from Middle Africa are Uruguayan (92.9%, a difference of 0.020%), Immigrants from Afghanistan (92.8%, a difference of 0.040%), Spanish American (92.9%, a difference of 0.050%), Colombian (92.8%, a difference of 0.050%), and Immigrants from Senegal (92.8%, a difference of 0.050%).
| Demographics | Rating | Rank | 10th Grade |
| Costa Ricans | 4.2 /100 | #239 | Tragic 93.1% |
| Immigrants | Hong Kong | 4.2 /100 | #240 | Tragic 93.1% |
| Immigrants | Somalia | 2.7 /100 | #241 | Tragic 93.0% |
| Immigrants | Cameroon | 2.6 /100 | #242 | Tragic 93.0% |
| Senegalese | 2.4 /100 | #243 | Tragic 93.0% |
| Spanish Americans | 2.1 /100 | #244 | Tragic 92.9% |
| Uruguayans | 1.8 /100 | #245 | Tragic 92.9% |
| Immigrants | Middle Africa | 1.7 /100 | #246 | Tragic 92.9% |
| Immigrants | Afghanistan | 1.4 /100 | #247 | Tragic 92.8% |
| Colombians | 1.4 /100 | #248 | Tragic 92.8% |
| Immigrants | Senegal | 1.4 /100 | #249 | Tragic 92.8% |
| Jamaicans | 1.2 /100 | #250 | Tragic 92.8% |
| Immigrants | Thailand | 1.0 /100 | #251 | Tragic 92.8% |
| South Americans | 0.9 /100 | #252 | Tragic 92.8% |
| Ghanaians | 0.9 /100 | #253 | Tragic 92.8% |