Immigrants from Congo vs Immigrants from Denmark Disability Age 5 to 17
COMPARE
Immigrants from Congo
Immigrants from Denmark
Disability Age 5 to 17
Disability Age 5 to 17 Comparison
Immigrants from Congo
Immigrants from Denmark
6.2%
DISABILITY AGE 5 TO 17
0.0/ 100
METRIC RATING
290th/ 347
METRIC RANK
5.4%
DISABILITY AGE 5 TO 17
91.4/ 100
METRIC RATING
136th/ 347
METRIC RANK
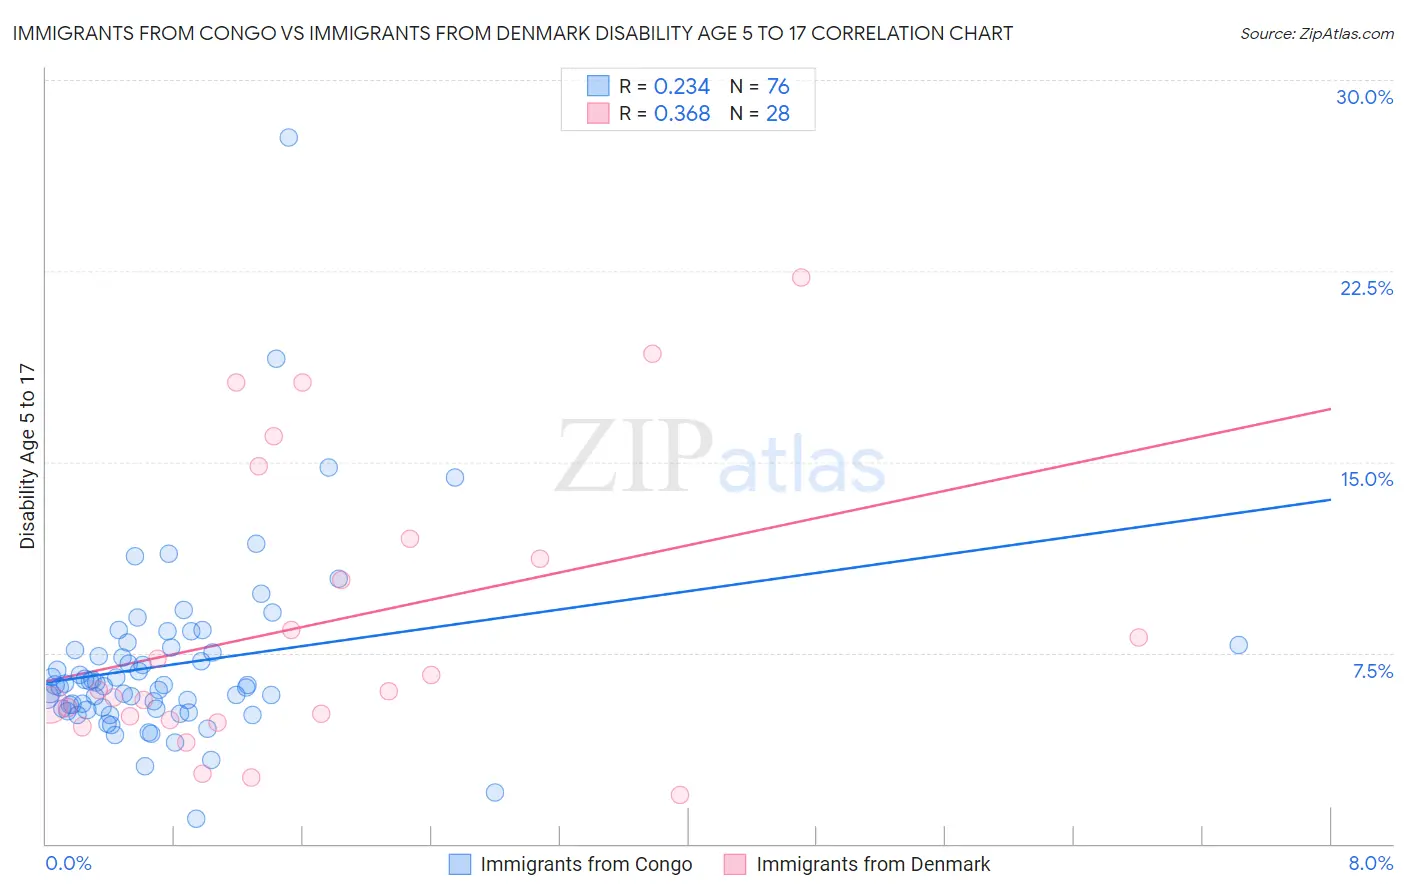
Immigrants from Congo vs Immigrants from Denmark Disability Age 5 to 17 Correlation Chart
The statistical analysis conducted on geographies consisting of 91,997,133 people shows a weak positive correlation between the proportion of Immigrants from Congo and percentage of population with a disability between the ages 5 and 17 in the United States with a correlation coefficient (R) of 0.234 and weighted average of 6.2%. Similarly, the statistical analysis conducted on geographies consisting of 135,667,320 people shows a mild positive correlation between the proportion of Immigrants from Denmark and percentage of population with a disability between the ages 5 and 17 in the United States with a correlation coefficient (R) of 0.368 and weighted average of 5.4%, a difference of 13.9%.
Disability Age 5 to 17 Correlation Summary
| Measurement | Immigrants from Congo | Immigrants from Denmark |
| Minimum | 0.97% | 1.9% |
| Maximum | 27.7% | 22.3% |
| Range | 26.7% | 20.4% |
| Mean | 7.0% | 8.7% |
| Median | 6.2% | 6.0% |
| Interquartile 25% (IQ1) | 5.3% | 4.9% |
| Interquartile 75% (IQ3) | 7.7% | 11.6% |
| Interquartile Range (IQR) | 2.3% | 6.7% |
| Standard Deviation (Sample) | 3.6% | 5.6% |
| Standard Deviation (Population) | 3.6% | 5.5% |
Similar Demographics by Disability Age 5 to 17
Demographics Similar to Immigrants from Congo by Disability Age 5 to 17
In terms of disability age 5 to 17, the demographic groups most similar to Immigrants from Congo are Yaqui (6.2%, a difference of 0.0%), Jamaican (6.2%, a difference of 0.010%), White/Caucasian (6.2%, a difference of 0.15%), Pima (6.2%, a difference of 0.27%), and Immigrants from Senegal (6.2%, a difference of 0.39%).
| Demographics | Rating | Rank | Disability Age 5 to 17 |
| Ugandans | 0.0 /100 | #283 | Tragic 6.2% |
| Sub-Saharan Africans | 0.0 /100 | #284 | Tragic 6.2% |
| English | 0.0 /100 | #285 | Tragic 6.2% |
| Colville | 0.0 /100 | #286 | Tragic 6.2% |
| Pima | 0.0 /100 | #287 | Tragic 6.2% |
| Jamaicans | 0.0 /100 | #288 | Tragic 6.2% |
| Yaqui | 0.0 /100 | #289 | Tragic 6.2% |
| Immigrants | Congo | 0.0 /100 | #290 | Tragic 6.2% |
| Whites/Caucasians | 0.0 /100 | #291 | Tragic 6.2% |
| Immigrants | Senegal | 0.0 /100 | #292 | Tragic 6.2% |
| Central American Indians | 0.0 /100 | #293 | Tragic 6.2% |
| Irish | 0.0 /100 | #294 | Tragic 6.2% |
| Cree | 0.0 /100 | #295 | Tragic 6.2% |
| Spanish Americans | 0.0 /100 | #296 | Tragic 6.2% |
| Immigrants | Bahamas | 0.0 /100 | #297 | Tragic 6.2% |
Demographics Similar to Immigrants from Denmark by Disability Age 5 to 17
In terms of disability age 5 to 17, the demographic groups most similar to Immigrants from Denmark are Immigrants from Belize (5.4%, a difference of 0.050%), Navajo (5.4%, a difference of 0.080%), Immigrants from Oceania (5.4%, a difference of 0.090%), Belizean (5.4%, a difference of 0.090%), and Immigrants from Netherlands (5.4%, a difference of 0.14%).
| Demographics | Rating | Rank | Disability Age 5 to 17 |
| Romanians | 94.1 /100 | #129 | Exceptional 5.4% |
| Immigrants | Bulgaria | 94.0 /100 | #130 | Exceptional 5.4% |
| Arabs | 92.9 /100 | #131 | Exceptional 5.4% |
| Immigrants | Colombia | 92.9 /100 | #132 | Exceptional 5.4% |
| Venezuelans | 92.7 /100 | #133 | Exceptional 5.4% |
| Yuman | 92.3 /100 | #134 | Exceptional 5.4% |
| Immigrants | Belize | 91.7 /100 | #135 | Exceptional 5.4% |
| Immigrants | Denmark | 91.4 /100 | #136 | Exceptional 5.4% |
| Navajo | 90.9 /100 | #137 | Exceptional 5.4% |
| Immigrants | Oceania | 90.8 /100 | #138 | Exceptional 5.4% |
| Belizeans | 90.8 /100 | #139 | Exceptional 5.4% |
| Immigrants | Netherlands | 90.5 /100 | #140 | Exceptional 5.4% |
| South American Indians | 89.3 /100 | #141 | Excellent 5.5% |
| Colombians | 88.0 /100 | #142 | Excellent 5.5% |
| Immigrants | Hungary | 87.9 /100 | #143 | Excellent 5.5% |