Immigrants from Congo vs Spanish Disability Age 5 to 17
COMPARE
Immigrants from Congo
Spanish
Disability Age 5 to 17
Disability Age 5 to 17 Comparison
Immigrants from Congo
Spanish
6.2%
DISABILITY AGE 5 TO 17
0.0/ 100
METRIC RATING
290th/ 347
METRIC RANK
6.0%
DISABILITY AGE 5 TO 17
0.5/ 100
METRIC RATING
267th/ 347
METRIC RANK
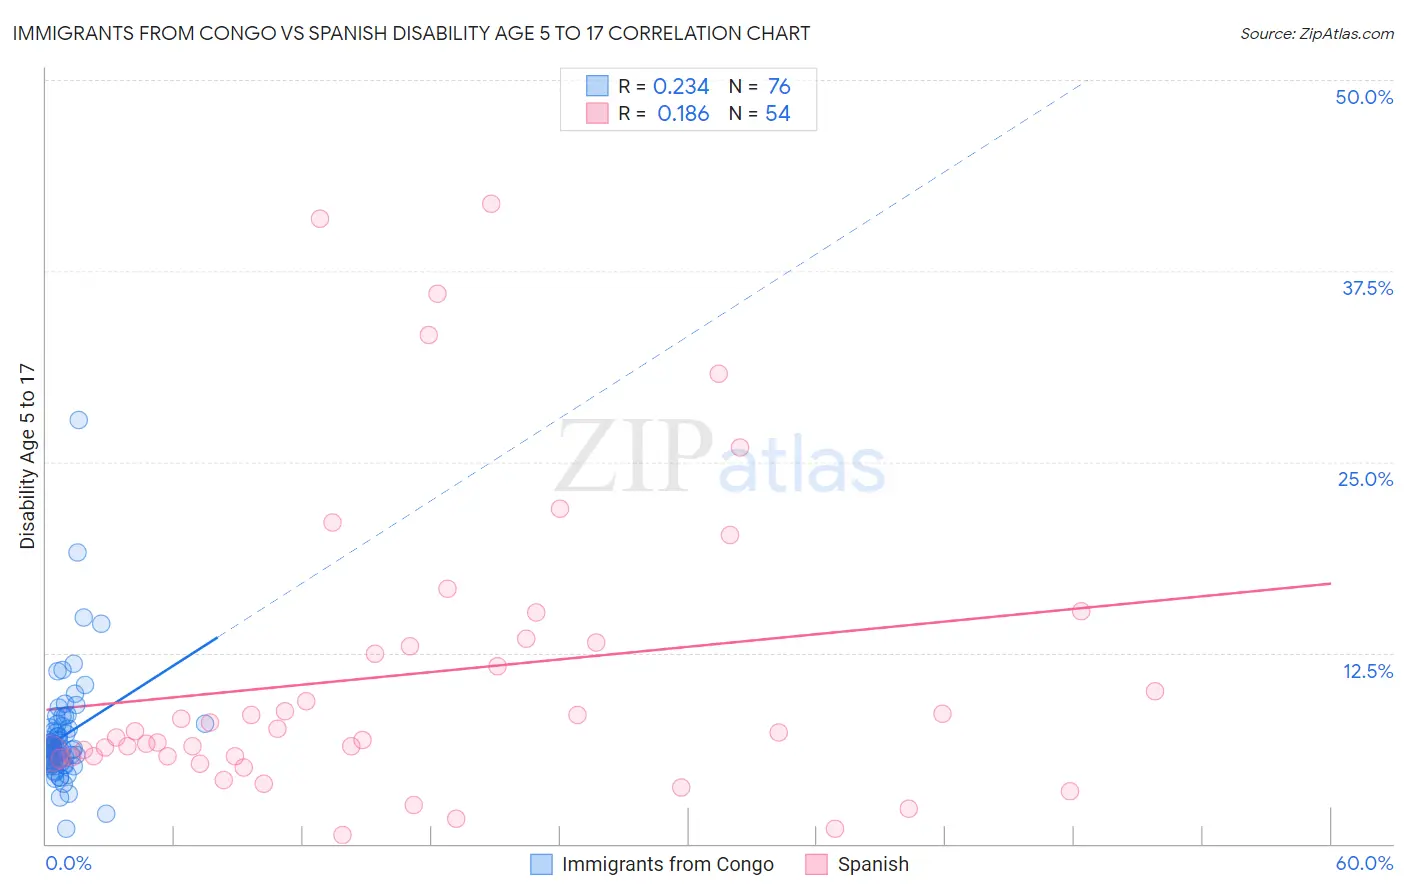
Immigrants from Congo vs Spanish Disability Age 5 to 17 Correlation Chart
The statistical analysis conducted on geographies consisting of 91,997,133 people shows a weak positive correlation between the proportion of Immigrants from Congo and percentage of population with a disability between the ages 5 and 17 in the United States with a correlation coefficient (R) of 0.234 and weighted average of 6.2%. Similarly, the statistical analysis conducted on geographies consisting of 418,244,761 people shows a poor positive correlation between the proportion of Spanish and percentage of population with a disability between the ages 5 and 17 in the United States with a correlation coefficient (R) of 0.186 and weighted average of 6.0%, a difference of 3.8%.
Disability Age 5 to 17 Correlation Summary
| Measurement | Immigrants from Congo | Spanish |
| Minimum | 0.97% | 0.61% |
| Maximum | 27.7% | 41.9% |
| Range | 26.7% | 41.3% |
| Mean | 7.0% | 11.1% |
| Median | 6.2% | 7.3% |
| Interquartile 25% (IQ1) | 5.3% | 5.7% |
| Interquartile 75% (IQ3) | 7.7% | 13.2% |
| Interquartile Range (IQR) | 2.3% | 7.5% |
| Standard Deviation (Sample) | 3.6% | 9.8% |
| Standard Deviation (Population) | 3.6% | 9.8% |
Similar Demographics by Disability Age 5 to 17
Demographics Similar to Immigrants from Congo by Disability Age 5 to 17
In terms of disability age 5 to 17, the demographic groups most similar to Immigrants from Congo are Yaqui (6.2%, a difference of 0.0%), Jamaican (6.2%, a difference of 0.010%), White/Caucasian (6.2%, a difference of 0.15%), Pima (6.2%, a difference of 0.27%), and Immigrants from Senegal (6.2%, a difference of 0.39%).
| Demographics | Rating | Rank | Disability Age 5 to 17 |
| Ugandans | 0.0 /100 | #283 | Tragic 6.2% |
| Sub-Saharan Africans | 0.0 /100 | #284 | Tragic 6.2% |
| English | 0.0 /100 | #285 | Tragic 6.2% |
| Colville | 0.0 /100 | #286 | Tragic 6.2% |
| Pima | 0.0 /100 | #287 | Tragic 6.2% |
| Jamaicans | 0.0 /100 | #288 | Tragic 6.2% |
| Yaqui | 0.0 /100 | #289 | Tragic 6.2% |
| Immigrants | Congo | 0.0 /100 | #290 | Tragic 6.2% |
| Whites/Caucasians | 0.0 /100 | #291 | Tragic 6.2% |
| Immigrants | Senegal | 0.0 /100 | #292 | Tragic 6.2% |
| Central American Indians | 0.0 /100 | #293 | Tragic 6.2% |
| Irish | 0.0 /100 | #294 | Tragic 6.2% |
| Cree | 0.0 /100 | #295 | Tragic 6.2% |
| Spanish Americans | 0.0 /100 | #296 | Tragic 6.2% |
| Immigrants | Bahamas | 0.0 /100 | #297 | Tragic 6.2% |
Demographics Similar to Spanish by Disability Age 5 to 17
In terms of disability age 5 to 17, the demographic groups most similar to Spanish are Slovene (6.0%, a difference of 0.11%), Panamanian (6.0%, a difference of 0.13%), Sioux (6.0%, a difference of 0.19%), Canadian (6.0%, a difference of 0.21%), and Liberian (6.0%, a difference of 0.22%).
| Demographics | Rating | Rank | Disability Age 5 to 17 |
| Somalis | 0.8 /100 | #260 | Tragic 5.9% |
| Immigrants | Middle Africa | 0.7 /100 | #261 | Tragic 5.9% |
| Immigrants | Western Africa | 0.7 /100 | #262 | Tragic 5.9% |
| Czechoslovakians | 0.7 /100 | #263 | Tragic 5.9% |
| Canadians | 0.6 /100 | #264 | Tragic 6.0% |
| Panamanians | 0.6 /100 | #265 | Tragic 6.0% |
| Slovenes | 0.6 /100 | #266 | Tragic 6.0% |
| Spanish | 0.5 /100 | #267 | Tragic 6.0% |
| Sioux | 0.4 /100 | #268 | Tragic 6.0% |
| Liberians | 0.4 /100 | #269 | Tragic 6.0% |
| Immigrants | Somalia | 0.4 /100 | #270 | Tragic 6.0% |
| Immigrants | Zaire | 0.2 /100 | #271 | Tragic 6.0% |
| Finns | 0.2 /100 | #272 | Tragic 6.0% |
| Alaska Natives | 0.2 /100 | #273 | Tragic 6.0% |
| Cheyenne | 0.2 /100 | #274 | Tragic 6.0% |