Immigrants from Burma/Myanmar vs Immigrants from West Indies Disability Age 5 to 17
COMPARE
Immigrants from Burma/Myanmar
Immigrants from West Indies
Disability Age 5 to 17
Disability Age 5 to 17 Comparison
Immigrants from Burma/Myanmar
Immigrants from West Indies
5.6%
DISABILITY AGE 5 TO 17
59.3/ 100
METRIC RATING
167th/ 347
METRIC RANK
5.8%
DISABILITY AGE 5 TO 17
3.5/ 100
METRIC RATING
233rd/ 347
METRIC RANK
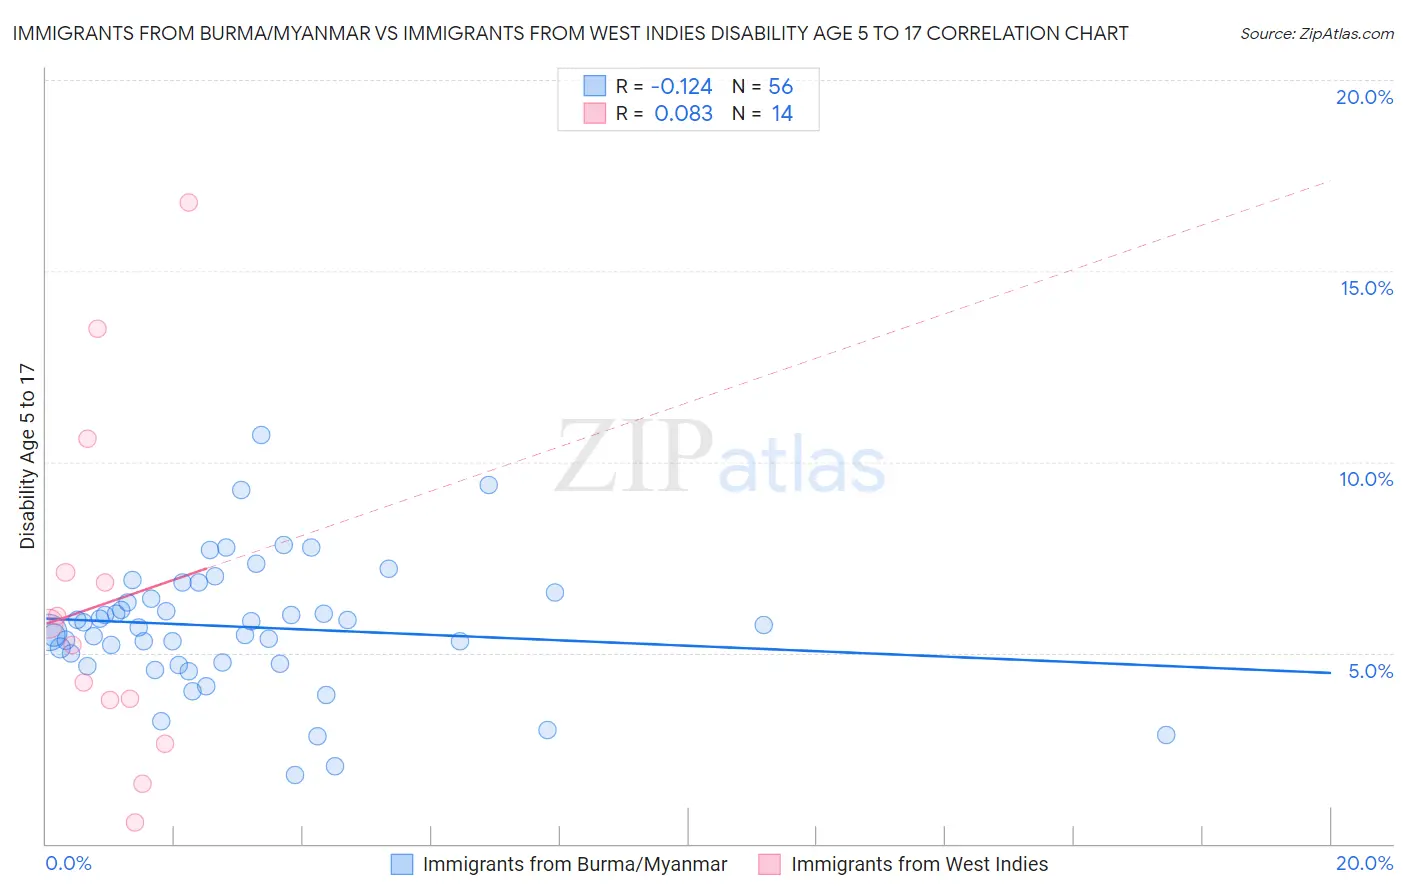
Immigrants from Burma/Myanmar vs Immigrants from West Indies Disability Age 5 to 17 Correlation Chart
The statistical analysis conducted on geographies consisting of 171,966,174 people shows a poor negative correlation between the proportion of Immigrants from Burma/Myanmar and percentage of population with a disability between the ages 5 and 17 in the United States with a correlation coefficient (R) of -0.124 and weighted average of 5.6%. Similarly, the statistical analysis conducted on geographies consisting of 72,374,754 people shows a slight positive correlation between the proportion of Immigrants from West Indies and percentage of population with a disability between the ages 5 and 17 in the United States with a correlation coefficient (R) of 0.083 and weighted average of 5.8%, a difference of 4.6%.
Disability Age 5 to 17 Correlation Summary
| Measurement | Immigrants from Burma/Myanmar | Immigrants from West Indies |
| Minimum | 1.8% | 0.57% |
| Maximum | 10.7% | 16.8% |
| Range | 8.9% | 16.2% |
| Mean | 5.7% | 6.3% |
| Median | 5.7% | 5.5% |
| Interquartile 25% (IQ1) | 4.7% | 3.8% |
| Interquartile 75% (IQ3) | 6.5% | 7.1% |
| Interquartile Range (IQR) | 1.8% | 3.3% |
| Standard Deviation (Sample) | 1.7% | 4.5% |
| Standard Deviation (Population) | 1.7% | 4.4% |
Similar Demographics by Disability Age 5 to 17
Demographics Similar to Immigrants from Burma/Myanmar by Disability Age 5 to 17
In terms of disability age 5 to 17, the demographic groups most similar to Immigrants from Burma/Myanmar are Greek (5.6%, a difference of 0.070%), Lebanese (5.6%, a difference of 0.11%), Immigrants from Scotland (5.6%, a difference of 0.13%), Iraqi (5.6%, a difference of 0.17%), and Immigrants from Norway (5.6%, a difference of 0.18%).
| Demographics | Rating | Rank | Disability Age 5 to 17 |
| South Africans | 73.3 /100 | #160 | Good 5.5% |
| Immigrants | Saudi Arabia | 69.1 /100 | #161 | Good 5.5% |
| Zimbabweans | 67.2 /100 | #162 | Good 5.5% |
| Immigrants | Southern Europe | 64.0 /100 | #163 | Good 5.6% |
| Immigrants | Scotland | 61.9 /100 | #164 | Good 5.6% |
| Lebanese | 61.4 /100 | #165 | Good 5.6% |
| Greeks | 60.6 /100 | #166 | Good 5.6% |
| Immigrants | Burma/Myanmar | 59.3 /100 | #167 | Average 5.6% |
| Iraqis | 56.0 /100 | #168 | Average 5.6% |
| Immigrants | Norway | 55.7 /100 | #169 | Average 5.6% |
| Serbians | 54.0 /100 | #170 | Average 5.6% |
| Immigrants | Iraq | 53.9 /100 | #171 | Average 5.6% |
| Ukrainians | 51.5 /100 | #172 | Average 5.6% |
| Uruguayans | 51.0 /100 | #173 | Average 5.6% |
| Costa Ricans | 50.0 /100 | #174 | Average 5.6% |
Demographics Similar to Immigrants from West Indies by Disability Age 5 to 17
In terms of disability age 5 to 17, the demographic groups most similar to Immigrants from West Indies are Immigrants from Kenya (5.8%, a difference of 0.040%), Malaysian (5.8%, a difference of 0.050%), Immigrants from Laos (5.8%, a difference of 0.090%), Immigrants from Brazil (5.8%, a difference of 0.11%), and Sudanese (5.8%, a difference of 0.26%).
| Demographics | Rating | Rank | Disability Age 5 to 17 |
| British West Indians | 5.4 /100 | #226 | Tragic 5.8% |
| Swiss | 5.1 /100 | #227 | Tragic 5.8% |
| Haitians | 4.8 /100 | #228 | Tragic 5.8% |
| Bangladeshis | 4.8 /100 | #229 | Tragic 5.8% |
| Ghanaians | 4.7 /100 | #230 | Tragic 5.8% |
| Europeans | 4.5 /100 | #231 | Tragic 5.8% |
| Immigrants | Laos | 3.8 /100 | #232 | Tragic 5.8% |
| Immigrants | West Indies | 3.5 /100 | #233 | Tragic 5.8% |
| Immigrants | Kenya | 3.4 /100 | #234 | Tragic 5.8% |
| Malaysians | 3.4 /100 | #235 | Tragic 5.8% |
| Immigrants | Brazil | 3.2 /100 | #236 | Tragic 5.8% |
| Sudanese | 2.9 /100 | #237 | Tragic 5.8% |
| Hungarians | 2.6 /100 | #238 | Tragic 5.8% |
| German Russians | 2.4 /100 | #239 | Tragic 5.9% |
| West Indians | 2.4 /100 | #240 | Tragic 5.9% |