Immigrants from Burma/Myanmar vs Scottish Householder Income Under 25 years

COMPARE

Immigrants from Burma/Myanmar
Race
Ancestry
AfghanAfricanAlaska NativeAlaskan AthabascanAlbanianAleutAlsatianAmericanApacheArabArapahoArgentineanArmenianAssyrian/Chaldean/SyriacAustralianAustrianBahamianBangladeshiBarbadianBasqueBelgianBelizeanBermudanBhutaneseBlackfeetBolivianBrazilianBritishBritish West IndianBulgarianBurmeseCajunCambodianCanadianCape VerdeanCarpatho RusynCelticCentral AmericanCentral American IndianCherokeeCheyenneChickasawChileanChineseChippewaChoctawColombianColvilleComancheCosta RicanCreeCreekCroatianCrowCubanCypriotCzechCzechoslovakianDanishDelawareDominicanDutchDutch West IndianEastern EuropeanEcuadorianEgyptianEnglishEstonianEthiopianEuropeanFijianFilipinoFinnishFrenchFrench American IndianFrench CanadianGermanGerman RussianGhanaianGreekGuamanian/ChamorroGuatemalanGuyaneseHaitianHmongHonduranHopiHoumaHungarianIcelanderIndian (Asian)IndonesianInupiatIranianIraqiIrishIroquoisIsraeliItalianJamaicanJapaneseJordanianKenyanKiowaKoreanLaotianLatvianLebaneseLiberianLithuanianLumbeeLuxembourgerMacedonianMalaysianMalteseMarshalleseMenomineeMexicanMexican American IndianMongolianMoroccanNative HawaiianNavajoNepaleseNew ZealanderNicaraguanNigerianNorthern EuropeanNorwegianOkinawanOsageOttawaPaiutePakistaniPalestinianPanamanianParaguayanPennsylvania GermanPeruvianPimaPolishPortuguesePotawatomiPuebloPuerto RicanPuget Sound SalishRomanianRussianSalvadoranSamoanScandinavianScotch-IrishSeminoleSenegaleseSerbianShoshoneSierra LeoneanSiouxSlavicSlovakSloveneSomaliSouth AfricanSouth AmericanSouth American IndianSoviet UnionSpaniardSpanishSpanish AmericanSpanish American IndianSri LankanSubsaharan AfricanSudaneseSwedishSwissSyrianTaiwaneseThaiTlingit-HaidaTohono O'OdhamTonganTrinidadian and TobagonianTsimshianTurkishU.S. Virgin IslanderUgandanUkrainianUruguayanUteVenezuelanVietnameseWelshWest IndianYakamaYaquiYugoslavianYumanYup'ikZimbabwean
Immigration
NonimmigrantsImmigrantsAfghanistanAfricaAlbaniaArgentinaArmeniaAsiaAustraliaAustriaBahamasBangladeshBarbadosBelarusBelgiumBelizeBoliviaBosnia and HerzegovinaBrazilBulgariaBurma/MyanmarCabo VerdeCambodiaCameroonCanadaCaribbeanCentral AmericaChileChinaColombiaCongoCosta RicaCroatiaCubaCzechoslovakiaDenmarkDominicaDominican RepublicEastern AfricaEastern AsiaEastern EuropeEcuadorEgyptEl SalvadorEnglandEritreaEthiopiaEuropeFijiFranceGermanyGhanaGreeceGrenadaGuatemalaGuyanaHaitiHondurasHong KongHungaryIndiaIndonesiaIranIraqIrelandIsraelItalyJamaicaJapanJordanKazakhstanKenyaKoreaKuwaitLaosLatin AmericaLatviaLebanonLiberiaLithuaniaMalaysiaMexicoMicronesiaMiddle AfricaMoldovaMoroccoNepalNetherlandsNicaraguaNigeriaNorth AmericaNorth MacedoniaNorthern AfricaNorthern EuropeNorwayOceaniaPakistanPanamaPeruPhilippinesPolandPortugalRomaniaRussiaSaudi ArabiaScotlandSenegalSerbiaSierra LeoneSingaporeSomaliaSouth AfricaSouth AmericaSouth Central AsiaSouth Eastern AsiaSouthern EuropeSpainSri LankaSt. Vincent and the GrenadinesSudanSwedenSwitzerlandSyriaTaiwanThailandTrinidad and TobagoTurkeyUgandaUkraineUruguayUzbekistanVenezuelaVietnamWest IndiesWestern AfricaWestern AsiaWestern EuropeYemenZaireZimbabweAzores
Scottish
Race
Ancestry
AfghanAfricanAlaska NativeAlaskan AthabascanAlbanianAleutAlsatianAmericanApacheArabArapahoArgentineanArmenianAssyrian/Chaldean/SyriacAustralianAustrianBahamianBangladeshiBarbadianBasqueBelgianBelizeanBermudanBhutaneseBlackfeetBolivianBrazilianBritishBritish West IndianBulgarianBurmeseCajunCambodianCanadianCape VerdeanCarpatho RusynCelticCentral AmericanCentral American IndianCherokeeCheyenneChickasawChileanChineseChippewaChoctawColombianColvilleComancheCosta RicanCreeCreekCroatianCrowCubanCypriotCzechCzechoslovakianDanishDelawareDominicanDutchDutch West IndianEastern EuropeanEcuadorianEgyptianEnglishEstonianEthiopianEuropeanFijianFilipinoFinnishFrenchFrench American IndianFrench CanadianGermanGerman RussianGhanaianGreekGuamanian/ChamorroGuatemalanGuyaneseHaitianHmongHonduranHopiHoumaHungarianIcelanderIndian (Asian)IndonesianInupiatIranianIraqiIrishIroquoisIsraeliItalianJamaicanJapaneseJordanianKenyanKiowaKoreanLaotianLatvianLebaneseLiberianLithuanianLumbeeLuxembourgerMacedonianMalaysianMalteseMarshalleseMenomineeMexicanMexican American IndianMongolianMoroccanNative HawaiianNavajoNepaleseNew ZealanderNicaraguanNigerianNorthern EuropeanNorwegianOkinawanOsageOttawaPaiutePakistaniPalestinianPanamanianParaguayanPennsylvania GermanPeruvianPimaPolishPortuguesePotawatomiPuebloPuerto RicanPuget Sound SalishRomanianRussianSalvadoranSamoanScandinavianScotch-IrishScottishSeminoleSenegaleseSerbianShoshoneSierra LeoneanSiouxSlavicSlovakSloveneSomaliSouth AfricanSouth AmericanSouth American IndianSoviet UnionSpaniardSpanishSpanish AmericanSpanish American IndianSri LankanSubsaharan AfricanSudaneseSwedishSwissSyrianTaiwaneseThaiTlingit-HaidaTohono O'OdhamTonganTrinidadian and TobagonianTsimshianTurkishU.S. Virgin IslanderUgandanUkrainianUruguayanUteVenezuelanVietnameseWelshWest IndianYakamaYaquiYugoslavianYumanYup'ikZimbabwean
Immigration
NonimmigrantsImmigrantsAfghanistanAfricaAlbaniaArgentinaArmeniaAsiaAustraliaAustriaBahamasBangladeshBarbadosBelarusBelgiumBelizeBoliviaBosnia and HerzegovinaBrazilBulgariaCabo VerdeCambodiaCameroonCanadaCaribbeanCentral AmericaChileChinaColombiaCongoCosta RicaCroatiaCubaCzechoslovakiaDenmarkDominicaDominican RepublicEastern AfricaEastern AsiaEastern EuropeEcuadorEgyptEl SalvadorEnglandEritreaEthiopiaEuropeFijiFranceGermanyGhanaGreeceGrenadaGuatemalaGuyanaHaitiHondurasHong KongHungaryIndiaIndonesiaIranIraqIrelandIsraelItalyJamaicaJapanJordanKazakhstanKenyaKoreaKuwaitLaosLatin AmericaLatviaLebanonLiberiaLithuaniaMalaysiaMexicoMicronesiaMiddle AfricaMoldovaMoroccoNepalNetherlandsNicaraguaNigeriaNorth AmericaNorth MacedoniaNorthern AfricaNorthern EuropeNorwayOceaniaPakistanPanamaPeruPhilippinesPolandPortugalRomaniaRussiaSaudi ArabiaScotlandSenegalSerbiaSierra LeoneSingaporeSomaliaSouth AfricaSouth AmericaSouth Central AsiaSouth Eastern AsiaSouthern EuropeSpainSri LankaSt. Vincent and the GrenadinesSudanSwedenSwitzerlandSyriaTaiwanThailandTrinidad and TobagoTurkeyUgandaUkraineUruguayUzbekistanVenezuelaVietnamWest IndiesWestern AfricaWestern AsiaWestern EuropeYemenZaireZimbabweAzores
Householder Income Under 25 years
Income
Poverty
Unemployment
Labor Participation
Family Structure
Vehicle Availability
Education Level
Disability

Householder Income Under 25 years Comparison

Immigrants from Burma/Myanmar

Scottish

Tragic
Tragic
$48,749
HOUSEHOLDER INCOME UNDER 25 YEARS
0.0/ 100
METRIC RATING
291st/ 347
METRIC RANK
$50,554
HOUSEHOLDER INCOME UNDER 25 YEARS
1.8/ 100
METRIC RATING
249th/ 347
METRIC RANK

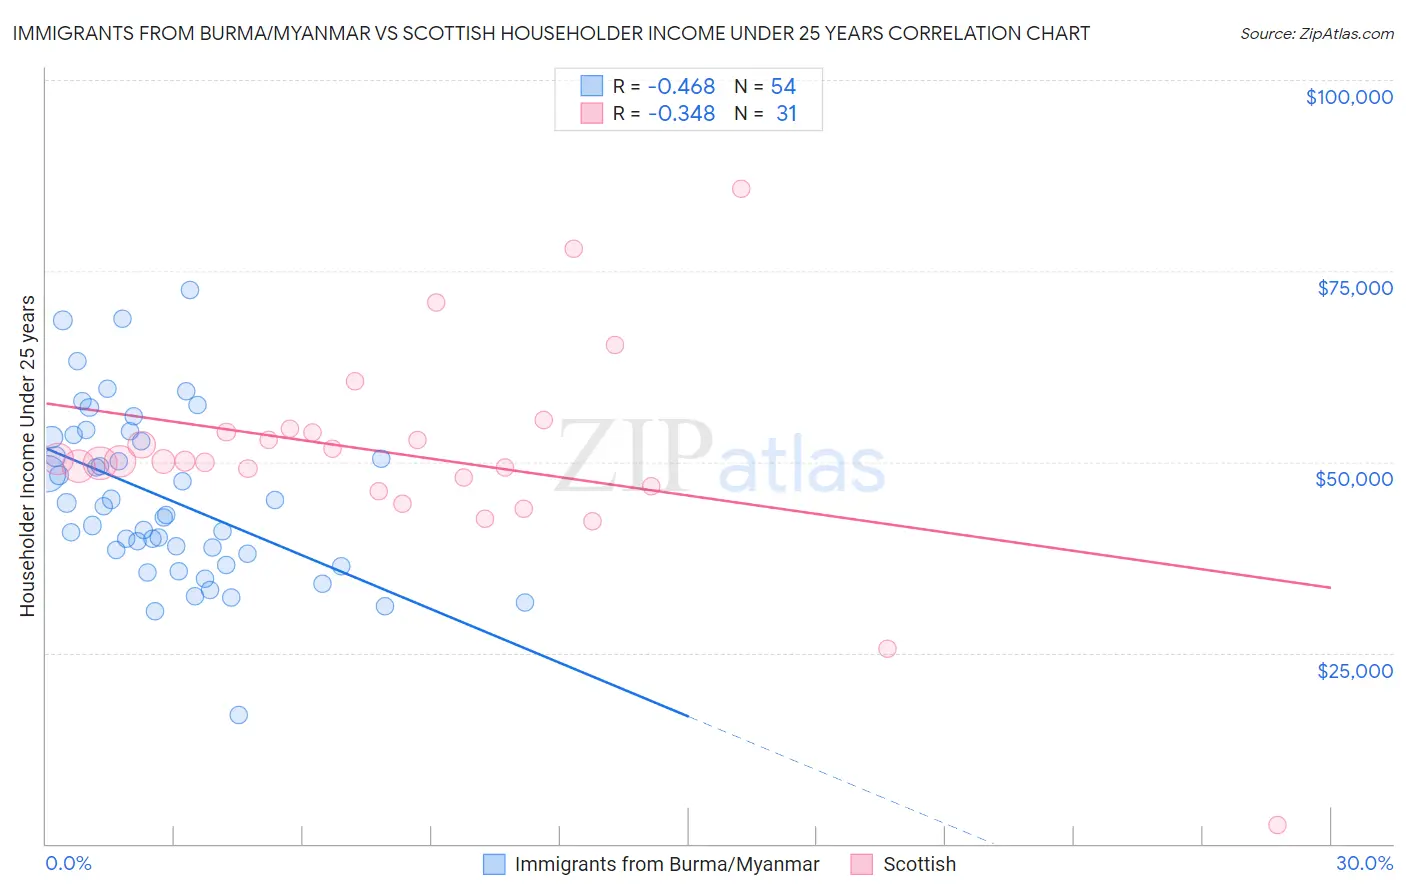
Immigrants from Burma/Myanmar vs Scottish Householder Income Under 25 years Correlation Chart

The statistical analysis conducted on geographies consisting of 158,147,131 people shows a moderate negative correlation between the proportion of Immigrants from Burma/Myanmar and household income with householder under the age of 25 in the United States with a correlation coefficient (R) of -0.468 and weighted average of $48,749. Similarly, the statistical analysis conducted on geographies consisting of 436,394,283 people shows a mild negative correlation between the proportion of Scottish and household income with householder under the age of 25 in the United States with a correlation coefficient (R) of -0.348 and weighted average of $50,554, a difference of 3.7%.
Immigrants from Burma/Myanmar vs Scottish Householder Income Under 25 years

Householder Income Under 25 years Correlation Summary

MeasurementImmigrants from Burma/MyanmarScottish
Minimum$16,806$2,499
Maximum$72,545$85,781
Range$55,739$83,282
Mean$45,291$50,902
Median$43,645$50,084
Interquartile 25% (IQ1)$37,955$46,875
Interquartile 75% (IQ3)$53,234$53,902
Interquartile Range (IQR)$15,279$7,027
Standard Deviation (Sample)$11,040$14,135
Standard Deviation (Population)$10,937$13,905

Similar Demographics by Householder Income Under 25 years

Demographics Similar to Immigrants from Burma/Myanmar by Householder Income Under 25 years

In terms of householder income under 25 years, the demographic groups most similar to Immigrants from Burma/Myanmar are Shoshone ($48,720, a difference of 0.060%), Subsaharan African ($48,691, a difference of 0.12%), Somali ($48,657, a difference of 0.19%), Central American Indian ($48,643, a difference of 0.22%), and American ($48,860, a difference of 0.23%).
DemographicsRating | RankHouseholder Income Under 25 years
Carpatho Rusyns
0.1
/100
|
#284
Tragic
$49,113
Scotch-Irish
0.0
/100
|
#285
Tragic
$49,039
French American Indians
0.0
/100
|
#286
Tragic
$48,977
Senegalese
0.0
/100
|
#287
Tragic
$48,953
Liberians
0.0
/100
|
#288
Tragic
$48,917
Hondurans
0.0
/100
|
#289
Tragic
$48,885
Americans
0.0
/100
|
#290
Tragic
$48,860
Immigrants | Burma/Myanmar
0.0
/100
|
#291
Tragic
$48,749
Shoshone
0.0
/100
|
#292
Tragic
$48,720
Sub-Saharan Africans
0.0
/100
|
#293
Tragic
$48,691
Somalis
0.0
/100
|
#294
Tragic
$48,657
Central American Indians
0.0
/100
|
#295
Tragic
$48,643
Blackfeet
0.0
/100
|
#296
Tragic
$48,603
Cree
0.0
/100
|
#297
Tragic
$48,514
Yaqui
0.0
/100
|
#298
Tragic
$48,300

Demographics Similar to Scottish by Householder Income Under 25 years

In terms of householder income under 25 years, the demographic groups most similar to Scottish are Immigrants from Bosnia and Herzegovina ($50,565, a difference of 0.020%), Slavic ($50,563, a difference of 0.020%), Immigrants from Cabo Verde ($50,520, a difference of 0.070%), Welsh ($50,597, a difference of 0.090%), and Immigrants from Africa ($50,609, a difference of 0.11%).
DemographicsRating | RankHouseholder Income Under 25 years
Cubans
2.3
/100
|
#242
Tragic
$50,655
Immigrants | Thailand
2.2
/100
|
#243
Tragic
$50,645
Marshallese
2.1
/100
|
#244
Tragic
$50,627
Immigrants | Africa
2.0
/100
|
#245
Tragic
$50,609
Welsh
2.0
/100
|
#246
Tragic
$50,597
Immigrants | Bosnia and Herzegovina
1.8
/100
|
#247
Tragic
$50,565
Slavs
1.8
/100
|
#248
Tragic
$50,563
Scottish
1.8
/100
|
#249
Tragic
$50,554
Immigrants | Cabo Verde
1.7
/100
|
#250
Tragic
$50,520
Celtics
1.4
/100
|
#251
Tragic
$50,447
Immigrants | Mexico
1.3
/100
|
#252
Tragic
$50,422
Immigrants | Haiti
1.2
/100
|
#253
Tragic
$50,398
Luxembourgers
1.2
/100
|
#254
Tragic
$50,379
Aleuts
1.2
/100
|
#255
Tragic
$50,377
Immigrants | Cuba
1.2
/100
|
#256
Tragic
$50,374