Immigrants from Burma/Myanmar vs Luxembourger Divorced or Separated
COMPARE
Immigrants from Burma/Myanmar
Luxembourger
Divorced or Separated
Divorced or Separated Comparison
Immigrants from Burma/Myanmar
Luxembourgers
12.1%
DIVORCED OR SEPARATED
30.4/ 100
METRIC RATING
196th/ 347
METRIC RANK
11.3%
DIVORCED OR SEPARATED
99.9/ 100
METRIC RATING
62nd/ 347
METRIC RANK
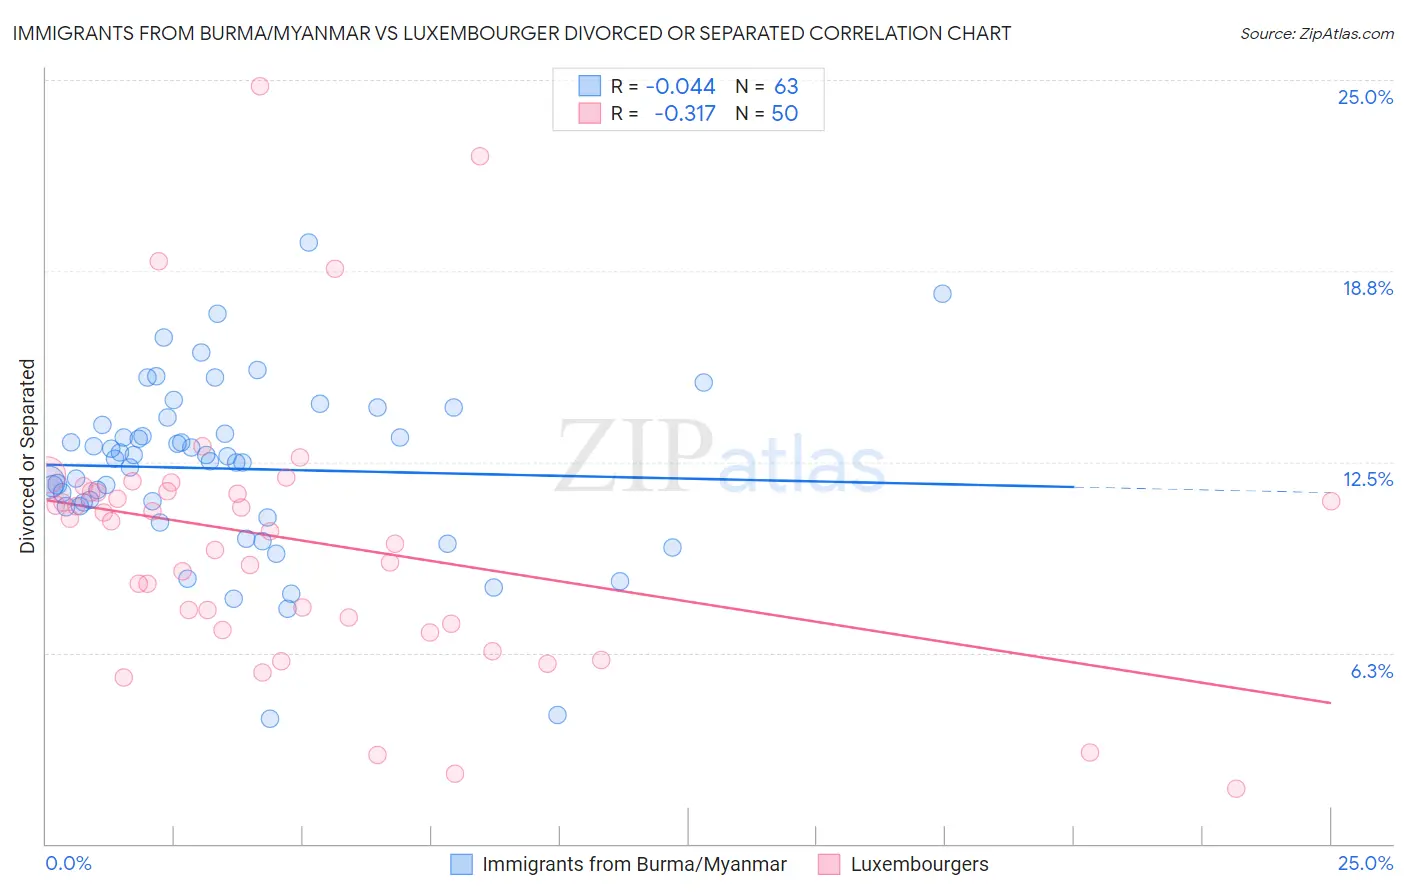
Immigrants from Burma/Myanmar vs Luxembourger Divorced or Separated Correlation Chart
The statistical analysis conducted on geographies consisting of 172,295,998 people shows no correlation between the proportion of Immigrants from Burma/Myanmar and percentage of population currently divorced or separated in the United States with a correlation coefficient (R) of -0.044 and weighted average of 12.1%. Similarly, the statistical analysis conducted on geographies consisting of 144,652,195 people shows a mild negative correlation between the proportion of Luxembourgers and percentage of population currently divorced or separated in the United States with a correlation coefficient (R) of -0.317 and weighted average of 11.3%, a difference of 7.0%.
Divorced or Separated Correlation Summary
| Measurement | Immigrants from Burma/Myanmar | Luxembourger |
| Minimum | 4.1% | 1.8% |
| Maximum | 19.7% | 24.8% |
| Range | 15.6% | 23.0% |
| Mean | 12.3% | 9.9% |
| Median | 12.6% | 10.4% |
| Interquartile 25% (IQ1) | 11.0% | 7.2% |
| Interquartile 75% (IQ3) | 13.7% | 11.5% |
| Interquartile Range (IQR) | 2.7% | 4.3% |
| Standard Deviation (Sample) | 2.8% | 4.5% |
| Standard Deviation (Population) | 2.8% | 4.4% |
Similar Demographics by Divorced or Separated
Demographics Similar to Immigrants from Burma/Myanmar by Divorced or Separated
In terms of divorced or separated, the demographic groups most similar to Immigrants from Burma/Myanmar are Immigrants from Africa (12.1%, a difference of 0.0%), Nigerian (12.1%, a difference of 0.010%), Immigrants from England (12.1%, a difference of 0.040%), Central American (12.1%, a difference of 0.040%), and Immigrants from Eritrea (12.1%, a difference of 0.060%).
| Demographics | Rating | Rank | Divorced or Separated |
| Sierra Leoneans | 35.5 /100 | #189 | Fair 12.1% |
| Moroccans | 34.8 /100 | #190 | Fair 12.1% |
| Swedes | 34.4 /100 | #191 | Fair 12.1% |
| Norwegians | 33.2 /100 | #192 | Fair 12.1% |
| Immigrants | Thailand | 32.5 /100 | #193 | Fair 12.1% |
| Immigrants | Eritrea | 31.9 /100 | #194 | Fair 12.1% |
| Immigrants | England | 31.4 /100 | #195 | Fair 12.1% |
| Immigrants | Burma/Myanmar | 30.4 /100 | #196 | Fair 12.1% |
| Immigrants | Africa | 30.3 /100 | #197 | Fair 12.1% |
| Nigerians | 30.1 /100 | #198 | Fair 12.1% |
| Central Americans | 29.4 /100 | #199 | Fair 12.1% |
| South Americans | 28.6 /100 | #200 | Fair 12.2% |
| Guatemalans | 26.9 /100 | #201 | Fair 12.2% |
| Portuguese | 23.5 /100 | #202 | Fair 12.2% |
| Immigrants | Guatemala | 23.2 /100 | #203 | Fair 12.2% |
Demographics Similar to Luxembourgers by Divorced or Separated
In terms of divorced or separated, the demographic groups most similar to Luxembourgers are Korean (11.3%, a difference of 0.0%), Immigrants from Russia (11.3%, a difference of 0.010%), Immigrants from Kuwait (11.3%, a difference of 0.010%), Israeli (11.3%, a difference of 0.17%), and Sri Lankan (11.3%, a difference of 0.27%).
| Demographics | Rating | Rank | Divorced or Separated |
| Immigrants | Yemen | 99.9 /100 | #55 | Exceptional 11.3% |
| Immigrants | Philippines | 99.9 /100 | #56 | Exceptional 11.3% |
| Immigrants | Vietnam | 99.9 /100 | #57 | Exceptional 11.3% |
| Sri Lankans | 99.9 /100 | #58 | Exceptional 11.3% |
| Israelis | 99.9 /100 | #59 | Exceptional 11.3% |
| Immigrants | Russia | 99.9 /100 | #60 | Exceptional 11.3% |
| Koreans | 99.9 /100 | #61 | Exceptional 11.3% |
| Luxembourgers | 99.9 /100 | #62 | Exceptional 11.3% |
| Immigrants | Kuwait | 99.9 /100 | #63 | Exceptional 11.3% |
| Macedonians | 99.8 /100 | #64 | Exceptional 11.4% |
| Immigrants | South Eastern Asia | 99.8 /100 | #65 | Exceptional 11.4% |
| Inupiat | 99.8 /100 | #66 | Exceptional 11.4% |
| Immigrants | Syria | 99.7 /100 | #67 | Exceptional 11.4% |
| Palestinians | 99.7 /100 | #68 | Exceptional 11.5% |
| Immigrants | Belgium | 99.7 /100 | #69 | Exceptional 11.5% |