Delaware vs French Disability Age Over 75
COMPARE
Delaware
French
Disability Age Over 75
Disability Age Over 75 Comparison
Delaware
French
47.5%
DISABILITY AGE OVER 75
39.1/ 100
METRIC RATING
183rd/ 347
METRIC RANK
47.2%
DISABILITY AGE OVER 75
64.6/ 100
METRIC RATING
164th/ 347
METRIC RANK
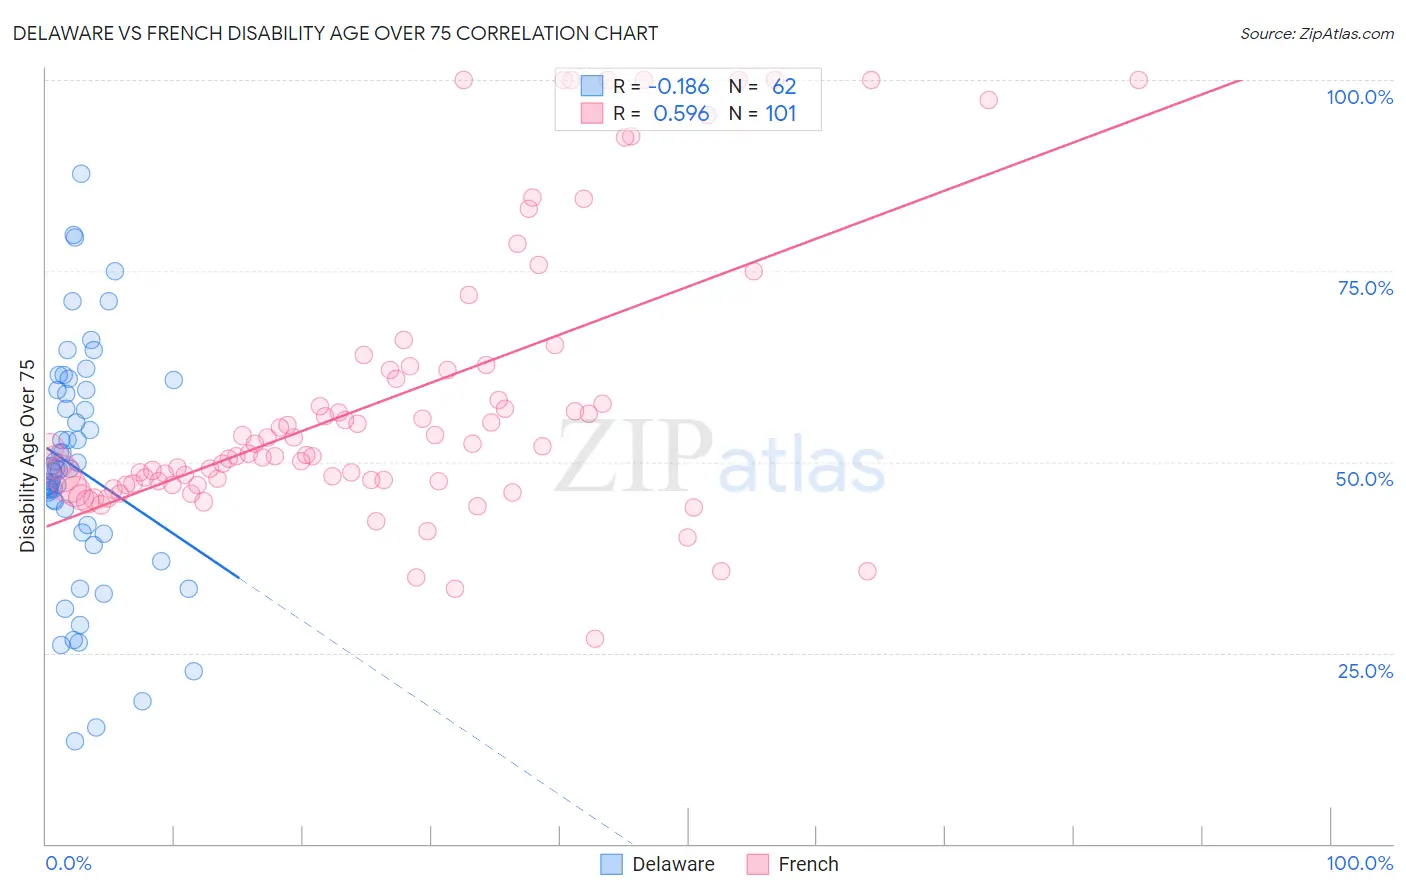
Delaware vs French Disability Age Over 75 Correlation Chart
The statistical analysis conducted on geographies consisting of 96,205,722 people shows a poor negative correlation between the proportion of Delaware and percentage of population with a disability over the age of 75 in the United States with a correlation coefficient (R) of -0.186 and weighted average of 47.5%. Similarly, the statistical analysis conducted on geographies consisting of 570,272,954 people shows a substantial positive correlation between the proportion of French and percentage of population with a disability over the age of 75 in the United States with a correlation coefficient (R) of 0.596 and weighted average of 47.2%, a difference of 0.59%.
Disability Age Over 75 Correlation Summary
| Measurement | Delaware | French |
| Minimum | 13.3% | 26.8% |
| Maximum | 87.7% | 100.0% |
| Range | 74.4% | 73.2% |
| Mean | 49.0% | 58.3% |
| Median | 49.0% | 51.0% |
| Interquartile 25% (IQ1) | 40.8% | 47.1% |
| Interquartile 75% (IQ3) | 59.4% | 62.3% |
| Interquartile Range (IQR) | 18.6% | 15.2% |
| Standard Deviation (Sample) | 15.5% | 18.4% |
| Standard Deviation (Population) | 15.4% | 18.3% |
Demographics Similar to Delaware and French by Disability Age Over 75
In terms of disability age over 75, the demographic groups most similar to Delaware are Immigrants from Moldova (47.4%, a difference of 0.020%), Immigrants from Kazakhstan (47.4%, a difference of 0.030%), Sierra Leonean (47.4%, a difference of 0.060%), Immigrants from Ecuador (47.4%, a difference of 0.060%), and Cuban (47.4%, a difference of 0.070%). Similarly, the demographic groups most similar to French are Immigrants from Zimbabwe (47.2%, a difference of 0.0%), Immigrants from Sierra Leone (47.2%, a difference of 0.010%), Immigrants from Eastern Africa (47.2%, a difference of 0.020%), Moroccan (47.2%, a difference of 0.040%), and Kenyan (47.2%, a difference of 0.14%).
| Demographics | Rating | Rank | Disability Age Over 75 |
| Immigrants | Eastern Africa | 65.5 /100 | #163 | Good 47.2% |
| French | 64.6 /100 | #164 | Good 47.2% |
| Immigrants | Zimbabwe | 64.4 /100 | #165 | Good 47.2% |
| Immigrants | Sierra Leone | 64.4 /100 | #166 | Good 47.2% |
| Moroccans | 62.9 /100 | #167 | Good 47.2% |
| Kenyans | 58.8 /100 | #168 | Average 47.2% |
| Celtics | 58.7 /100 | #169 | Average 47.2% |
| German Russians | 56.2 /100 | #170 | Average 47.3% |
| Immigrants | Africa | 53.6 /100 | #171 | Average 47.3% |
| Scotch-Irish | 52.5 /100 | #172 | Average 47.3% |
| Alsatians | 51.9 /100 | #173 | Average 47.3% |
| Whites/Caucasians | 50.0 /100 | #174 | Average 47.3% |
| Immigrants | Haiti | 49.7 /100 | #175 | Average 47.3% |
| Ecuadorians | 46.7 /100 | #176 | Average 47.4% |
| Haitians | 44.6 /100 | #177 | Average 47.4% |
| Cubans | 42.1 /100 | #178 | Average 47.4% |
| Sierra Leoneans | 41.7 /100 | #179 | Average 47.4% |
| Immigrants | Ecuador | 41.7 /100 | #180 | Average 47.4% |
| Immigrants | Kazakhstan | 40.4 /100 | #181 | Average 47.4% |
| Immigrants | Moldova | 39.9 /100 | #182 | Fair 47.4% |
| Delaware | 39.1 /100 | #183 | Fair 47.5% |