Immigrants from France vs French Disability Age Over 75
COMPARE
Immigrants from France
French
Disability Age Over 75
Disability Age Over 75 Comparison
Immigrants from France
French
45.8%
DISABILITY AGE OVER 75
99.7/ 100
METRIC RATING
52nd/ 347
METRIC RANK
47.2%
DISABILITY AGE OVER 75
64.6/ 100
METRIC RATING
164th/ 347
METRIC RANK
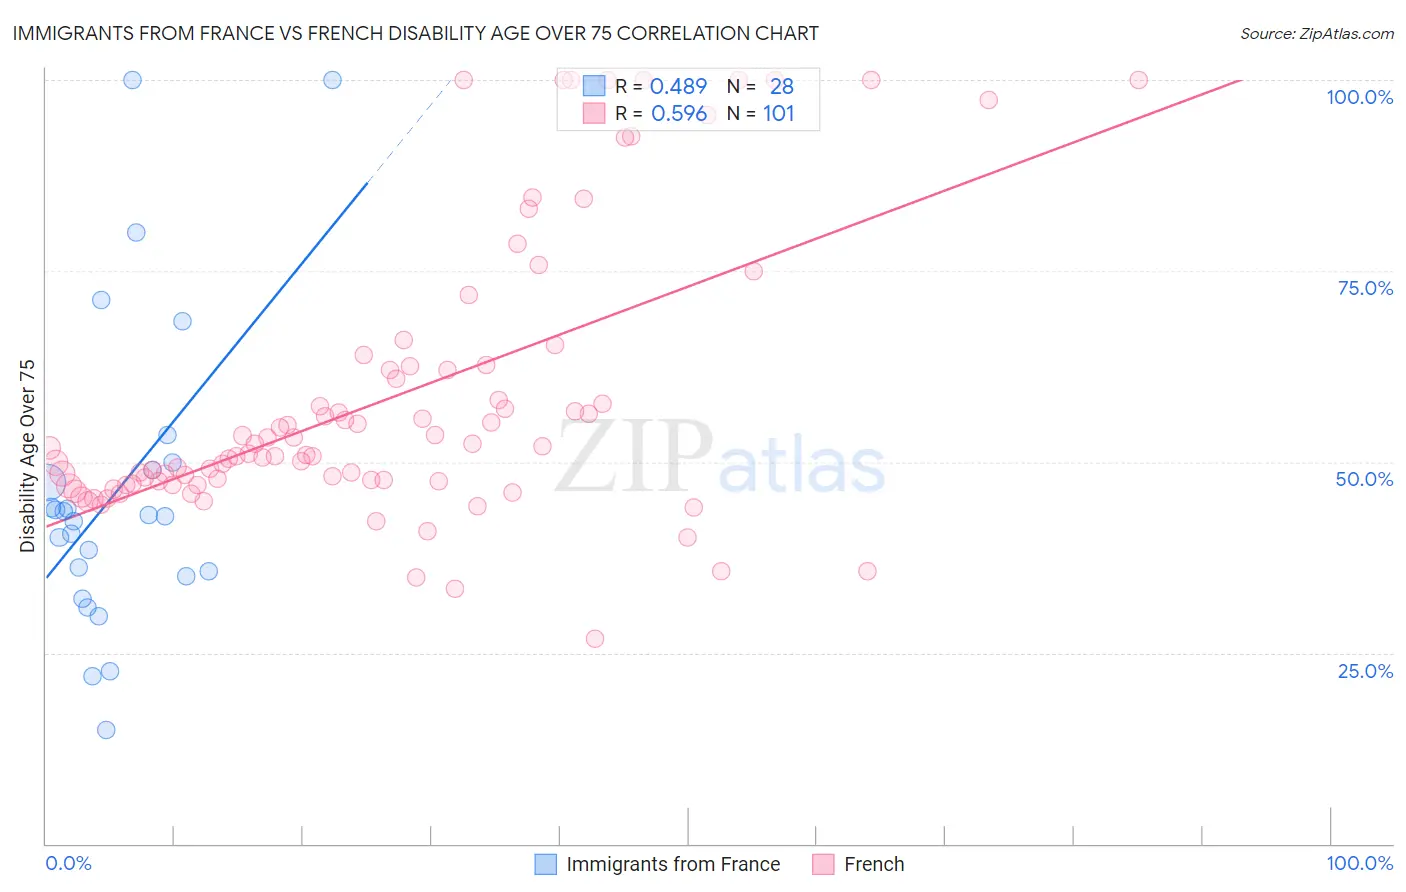
Immigrants from France vs French Disability Age Over 75 Correlation Chart
The statistical analysis conducted on geographies consisting of 287,676,099 people shows a moderate positive correlation between the proportion of Immigrants from France and percentage of population with a disability over the age of 75 in the United States with a correlation coefficient (R) of 0.489 and weighted average of 45.8%. Similarly, the statistical analysis conducted on geographies consisting of 570,272,954 people shows a substantial positive correlation between the proportion of French and percentage of population with a disability over the age of 75 in the United States with a correlation coefficient (R) of 0.596 and weighted average of 47.2%, a difference of 3.0%.
Disability Age Over 75 Correlation Summary
| Measurement | Immigrants from France | French |
| Minimum | 15.0% | 26.8% |
| Maximum | 100.0% | 100.0% |
| Range | 85.0% | 73.2% |
| Mean | 46.5% | 58.3% |
| Median | 43.0% | 51.0% |
| Interquartile 25% (IQ1) | 35.4% | 47.1% |
| Interquartile 75% (IQ3) | 49.5% | 62.3% |
| Interquartile Range (IQR) | 14.1% | 15.2% |
| Standard Deviation (Sample) | 20.6% | 18.4% |
| Standard Deviation (Population) | 20.2% | 18.3% |
Similar Demographics by Disability Age Over 75
Demographics Similar to Immigrants from France by Disability Age Over 75
In terms of disability age over 75, the demographic groups most similar to Immigrants from France are Immigrants from Italy (45.8%, a difference of 0.020%), Belgian (45.8%, a difference of 0.050%), Immigrants from Korea (45.8%, a difference of 0.050%), Slovak (45.8%, a difference of 0.090%), and Maltese (45.8%, a difference of 0.10%).
| Demographics | Rating | Rank | Disability Age Over 75 |
| Turks | 99.8 /100 | #45 | Exceptional 45.7% |
| Swedes | 99.8 /100 | #46 | Exceptional 45.7% |
| Immigrants | Canada | 99.8 /100 | #47 | Exceptional 45.7% |
| Croatians | 99.8 /100 | #48 | Exceptional 45.7% |
| Immigrants | North America | 99.8 /100 | #49 | Exceptional 45.7% |
| Belgians | 99.7 /100 | #50 | Exceptional 45.8% |
| Immigrants | Korea | 99.7 /100 | #51 | Exceptional 45.8% |
| Immigrants | France | 99.7 /100 | #52 | Exceptional 45.8% |
| Immigrants | Italy | 99.7 /100 | #53 | Exceptional 45.8% |
| Slovaks | 99.6 /100 | #54 | Exceptional 45.8% |
| Maltese | 99.6 /100 | #55 | Exceptional 45.8% |
| Immigrants | Netherlands | 99.6 /100 | #56 | Exceptional 45.9% |
| Immigrants | Turkey | 99.6 /100 | #57 | Exceptional 45.9% |
| Immigrants | Israel | 99.6 /100 | #58 | Exceptional 45.9% |
| Iranians | 99.6 /100 | #59 | Exceptional 45.9% |
Demographics Similar to French by Disability Age Over 75
In terms of disability age over 75, the demographic groups most similar to French are Immigrants from Zimbabwe (47.2%, a difference of 0.0%), Immigrants from Sierra Leone (47.2%, a difference of 0.010%), Immigrants from Eastern Africa (47.2%, a difference of 0.020%), Pennsylvania German (47.2%, a difference of 0.030%), and Moroccan (47.2%, a difference of 0.040%).
| Demographics | Rating | Rank | Disability Age Over 75 |
| Bhutanese | 72.6 /100 | #157 | Good 47.1% |
| Immigrants | Guyana | 71.9 /100 | #158 | Good 47.1% |
| Immigrants | Morocco | 71.4 /100 | #159 | Good 47.1% |
| Immigrants | Middle Africa | 68.3 /100 | #160 | Good 47.1% |
| South American Indians | 68.1 /100 | #161 | Good 47.1% |
| Pennsylvania Germans | 66.0 /100 | #162 | Good 47.2% |
| Immigrants | Eastern Africa | 65.5 /100 | #163 | Good 47.2% |
| French | 64.6 /100 | #164 | Good 47.2% |
| Immigrants | Zimbabwe | 64.4 /100 | #165 | Good 47.2% |
| Immigrants | Sierra Leone | 64.4 /100 | #166 | Good 47.2% |
| Moroccans | 62.9 /100 | #167 | Good 47.2% |
| Kenyans | 58.8 /100 | #168 | Average 47.2% |
| Celtics | 58.7 /100 | #169 | Average 47.2% |
| German Russians | 56.2 /100 | #170 | Average 47.3% |
| Immigrants | Africa | 53.6 /100 | #171 | Average 47.3% |