Tongan vs Danish Disability Age Over 75
COMPARE
Tongan
Danish
Disability Age Over 75
Disability Age Over 75 Comparison
Tongans
Danes
48.3%
DISABILITY AGE OVER 75
2.3/ 100
METRIC RATING
240th/ 347
METRIC RANK
46.2%
DISABILITY AGE OVER 75
98.6/ 100
METRIC RATING
87th/ 347
METRIC RANK
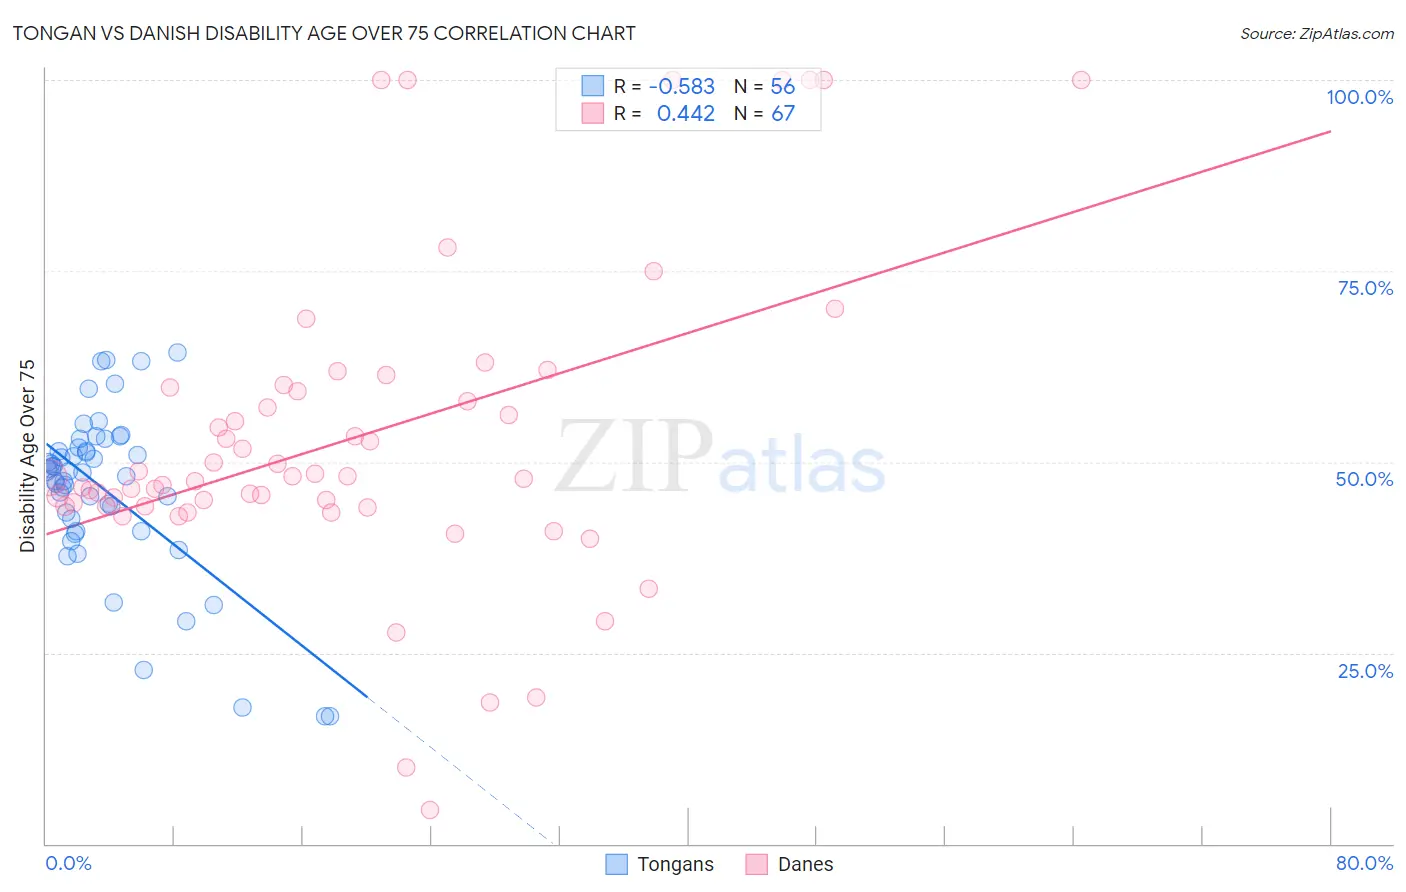
Tongan vs Danish Disability Age Over 75 Correlation Chart
The statistical analysis conducted on geographies consisting of 102,804,895 people shows a substantial negative correlation between the proportion of Tongans and percentage of population with a disability over the age of 75 in the United States with a correlation coefficient (R) of -0.583 and weighted average of 48.3%. Similarly, the statistical analysis conducted on geographies consisting of 473,146,755 people shows a moderate positive correlation between the proportion of Danes and percentage of population with a disability over the age of 75 in the United States with a correlation coefficient (R) of 0.442 and weighted average of 46.2%, a difference of 4.6%.
Disability Age Over 75 Correlation Summary
| Measurement | Tongan | Danish |
| Minimum | 16.7% | 4.4% |
| Maximum | 64.3% | 100.0% |
| Range | 47.6% | 95.6% |
| Mean | 46.3% | 53.1% |
| Median | 48.7% | 47.9% |
| Interquartile 25% (IQ1) | 41.7% | 44.1% |
| Interquartile 75% (IQ3) | 51.6% | 59.7% |
| Interquartile Range (IQR) | 9.9% | 15.6% |
| Standard Deviation (Sample) | 10.8% | 20.5% |
| Standard Deviation (Population) | 10.7% | 20.4% |
Similar Demographics by Disability Age Over 75
Demographics Similar to Tongans by Disability Age Over 75
In terms of disability age over 75, the demographic groups most similar to Tongans are Native Hawaiian (48.3%, a difference of 0.010%), French American Indian (48.3%, a difference of 0.010%), Immigrants from Caribbean (48.4%, a difference of 0.050%), Immigrants from Thailand (48.3%, a difference of 0.11%), and Afghan (48.4%, a difference of 0.14%).
| Demographics | Rating | Rank | Disability Age Over 75 |
| Cree | 4.2 /100 | #233 | Tragic 48.2% |
| Sub-Saharan Africans | 3.8 /100 | #234 | Tragic 48.2% |
| Hmong | 3.8 /100 | #235 | Tragic 48.2% |
| Immigrants | Nicaragua | 3.2 /100 | #236 | Tragic 48.2% |
| Immigrants | St. Vincent and the Grenadines | 3.2 /100 | #237 | Tragic 48.2% |
| Nicaraguans | 3.0 /100 | #238 | Tragic 48.3% |
| Immigrants | Thailand | 2.8 /100 | #239 | Tragic 48.3% |
| Tongans | 2.3 /100 | #240 | Tragic 48.3% |
| Native Hawaiians | 2.2 /100 | #241 | Tragic 48.3% |
| French American Indians | 2.2 /100 | #242 | Tragic 48.3% |
| Immigrants | Caribbean | 2.1 /100 | #243 | Tragic 48.4% |
| Afghans | 1.8 /100 | #244 | Tragic 48.4% |
| Americans | 1.7 /100 | #245 | Tragic 48.4% |
| Chippewa | 1.6 /100 | #246 | Tragic 48.4% |
| Iroquois | 1.6 /100 | #247 | Tragic 48.4% |
Demographics Similar to Danes by Disability Age Over 75
In terms of disability age over 75, the demographic groups most similar to Danes are Romanian (46.2%, a difference of 0.0%), Immigrants from Southern Europe (46.2%, a difference of 0.010%), Immigrants from Jordan (46.2%, a difference of 0.020%), Immigrants from Latvia (46.2%, a difference of 0.040%), and Argentinean (46.2%, a difference of 0.040%).
| Demographics | Rating | Rank | Disability Age Over 75 |
| Soviet Union | 98.8 /100 | #80 | Exceptional 46.2% |
| New Zealanders | 98.8 /100 | #81 | Exceptional 46.2% |
| Immigrants | Latvia | 98.7 /100 | #82 | Exceptional 46.2% |
| Argentineans | 98.7 /100 | #83 | Exceptional 46.2% |
| Immigrants | Jordan | 98.7 /100 | #84 | Exceptional 46.2% |
| Immigrants | Southern Europe | 98.6 /100 | #85 | Exceptional 46.2% |
| Romanians | 98.6 /100 | #86 | Exceptional 46.2% |
| Danes | 98.6 /100 | #87 | Exceptional 46.2% |
| Uruguayans | 98.4 /100 | #88 | Exceptional 46.2% |
| Immigrants | Saudi Arabia | 98.4 /100 | #89 | Exceptional 46.3% |
| Northern Europeans | 98.3 /100 | #90 | Exceptional 46.3% |
| Immigrants | Egypt | 98.3 /100 | #91 | Exceptional 46.3% |
| Germans | 98.2 /100 | #92 | Exceptional 46.3% |
| Ugandans | 98.2 /100 | #93 | Exceptional 46.3% |
| Albanians | 98.1 /100 | #94 | Exceptional 46.3% |