Immigrants from Burma/Myanmar vs Danish Disability Age 35 to 64
COMPARE
Immigrants from Burma/Myanmar
Danish
Disability Age 35 to 64
Disability Age 35 to 64 Comparison
Immigrants from Burma/Myanmar
Danes
12.3%
DISABILITY AGE 35 TO 64
1.2/ 100
METRIC RATING
250th/ 347
METRIC RANK
11.4%
DISABILITY AGE 35 TO 64
36.8/ 100
METRIC RATING
185th/ 347
METRIC RANK
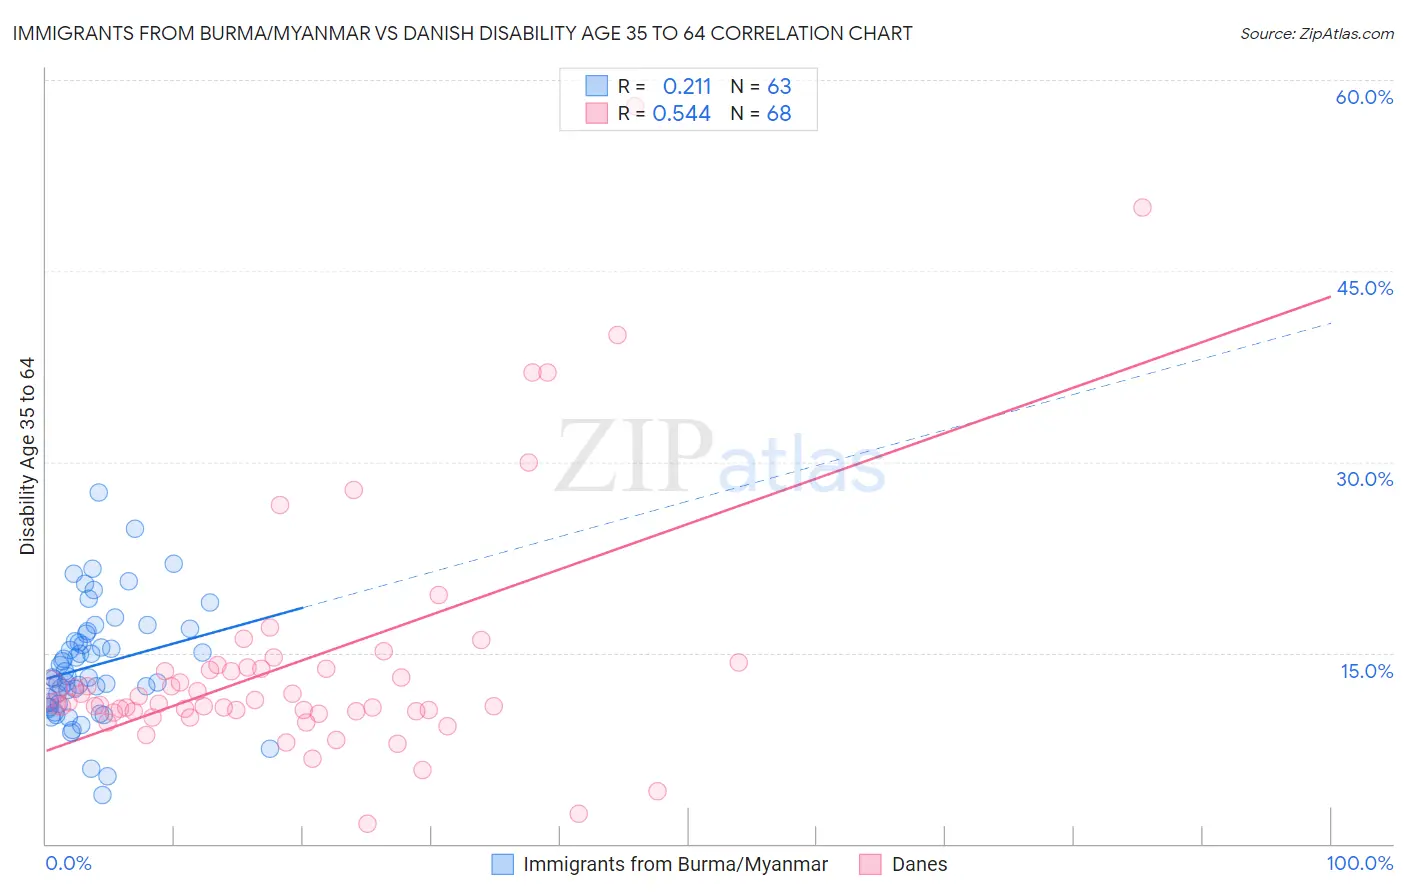
Immigrants from Burma/Myanmar vs Danish Disability Age 35 to 64 Correlation Chart
The statistical analysis conducted on geographies consisting of 172,272,577 people shows a weak positive correlation between the proportion of Immigrants from Burma/Myanmar and percentage of population with a disability between the ages 34 and 64 in the United States with a correlation coefficient (R) of 0.211 and weighted average of 12.3%. Similarly, the statistical analysis conducted on geographies consisting of 473,726,380 people shows a substantial positive correlation between the proportion of Danes and percentage of population with a disability between the ages 34 and 64 in the United States with a correlation coefficient (R) of 0.544 and weighted average of 11.4%, a difference of 7.7%.
Disability Age 35 to 64 Correlation Summary
| Measurement | Immigrants from Burma/Myanmar | Danish |
| Minimum | 3.9% | 1.5% |
| Maximum | 27.6% | 57.9% |
| Range | 23.7% | 56.4% |
| Mean | 14.0% | 14.3% |
| Median | 13.1% | 11.1% |
| Interquartile 25% (IQ1) | 11.0% | 10.4% |
| Interquartile 75% (IQ3) | 16.5% | 13.8% |
| Interquartile Range (IQR) | 5.5% | 3.4% |
| Standard Deviation (Sample) | 4.5% | 9.9% |
| Standard Deviation (Population) | 4.5% | 9.9% |
Similar Demographics by Disability Age 35 to 64
Demographics Similar to Immigrants from Burma/Myanmar by Disability Age 35 to 64
In terms of disability age 35 to 64, the demographic groups most similar to Immigrants from Burma/Myanmar are German (12.3%, a difference of 0.080%), Hispanic or Latino (12.3%, a difference of 0.13%), Spaniard (12.3%, a difference of 0.16%), Immigrants from Senegal (12.2%, a difference of 0.26%), and Guamanian/Chamorro (12.2%, a difference of 0.29%).
| Demographics | Rating | Rank | Disability Age 35 to 64 |
| Slovaks | 2.7 /100 | #243 | Tragic 12.1% |
| Finns | 2.3 /100 | #244 | Tragic 12.1% |
| Immigrants | Mexico | 2.2 /100 | #245 | Tragic 12.1% |
| Guamanians/Chamorros | 1.4 /100 | #246 | Tragic 12.2% |
| Immigrants | Senegal | 1.3 /100 | #247 | Tragic 12.2% |
| Spaniards | 1.3 /100 | #248 | Tragic 12.3% |
| Hispanics or Latinos | 1.3 /100 | #249 | Tragic 12.3% |
| Immigrants | Burma/Myanmar | 1.2 /100 | #250 | Tragic 12.3% |
| Germans | 1.1 /100 | #251 | Tragic 12.3% |
| Irish | 1.0 /100 | #252 | Tragic 12.3% |
| Dutch | 1.0 /100 | #253 | Tragic 12.3% |
| Hawaiians | 0.9 /100 | #254 | Tragic 12.3% |
| Japanese | 0.8 /100 | #255 | Tragic 12.3% |
| Scottish | 0.8 /100 | #256 | Tragic 12.4% |
| Mexicans | 0.7 /100 | #257 | Tragic 12.4% |
Demographics Similar to Danes by Disability Age 35 to 64
In terms of disability age 35 to 64, the demographic groups most similar to Danes are Slovene (11.4%, a difference of 0.010%), Immigrants from Bosnia and Herzegovina (11.4%, a difference of 0.14%), Northern European (11.4%, a difference of 0.16%), Hungarian (11.4%, a difference of 0.19%), and Kenyan (11.4%, a difference of 0.21%).
| Demographics | Rating | Rank | Disability Age 35 to 64 |
| Poles | 42.0 /100 | #178 | Average 11.3% |
| Immigrants | Barbados | 41.6 /100 | #179 | Average 11.3% |
| Immigrants | Caribbean | 41.5 /100 | #180 | Average 11.3% |
| Trinidadians and Tobagonians | 40.8 /100 | #181 | Average 11.4% |
| Icelanders | 39.7 /100 | #182 | Fair 11.4% |
| Immigrants | Oceania | 39.5 /100 | #183 | Fair 11.4% |
| Kenyans | 39.2 /100 | #184 | Fair 11.4% |
| Danes | 36.8 /100 | #185 | Fair 11.4% |
| Slovenes | 36.6 /100 | #186 | Fair 11.4% |
| Immigrants | Bosnia and Herzegovina | 35.2 /100 | #187 | Fair 11.4% |
| Northern Europeans | 34.9 /100 | #188 | Fair 11.4% |
| Hungarians | 34.6 /100 | #189 | Fair 11.4% |
| Immigrants | Nigeria | 32.5 /100 | #190 | Fair 11.4% |
| Swedes | 31.3 /100 | #191 | Fair 11.4% |
| Norwegians | 29.7 /100 | #192 | Fair 11.5% |