Hmong vs Cherokee Disability Age Over 75
COMPARE
Hmong
Cherokee
Disability Age Over 75
Disability Age Over 75 Comparison
Hmong
Cherokee
48.2%
DISABILITY AGE OVER 75
3.8/ 100
METRIC RATING
235th/ 347
METRIC RANK
50.2%
DISABILITY AGE OVER 75
0.0/ 100
METRIC RATING
302nd/ 347
METRIC RANK
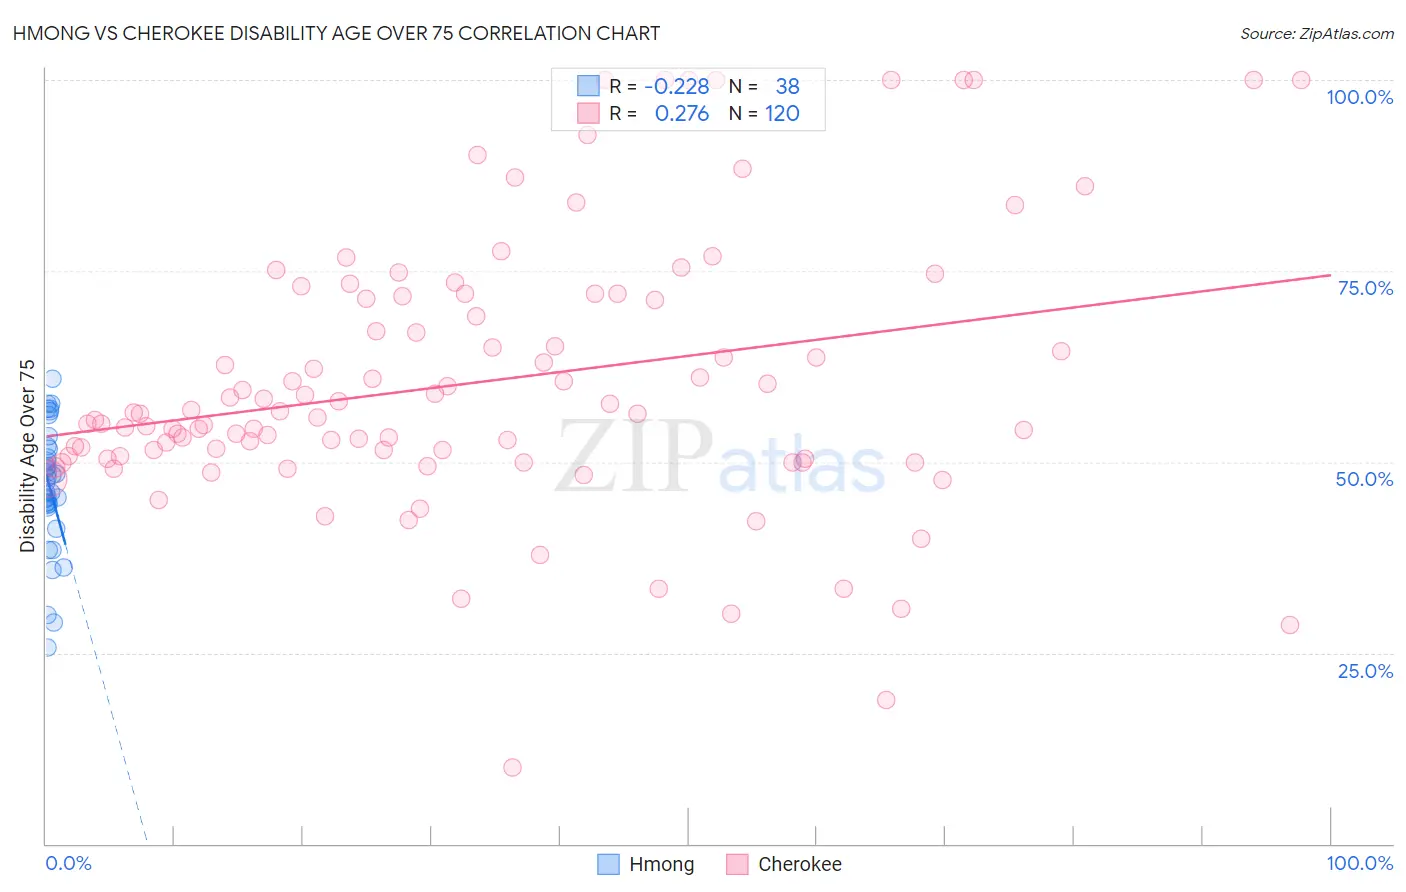
Hmong vs Cherokee Disability Age Over 75 Correlation Chart
The statistical analysis conducted on geographies consisting of 24,677,654 people shows a weak negative correlation between the proportion of Hmong and percentage of population with a disability over the age of 75 in the United States with a correlation coefficient (R) of -0.228 and weighted average of 48.2%. Similarly, the statistical analysis conducted on geographies consisting of 492,575,562 people shows a weak positive correlation between the proportion of Cherokee and percentage of population with a disability over the age of 75 in the United States with a correlation coefficient (R) of 0.276 and weighted average of 50.2%, a difference of 4.2%.
Disability Age Over 75 Correlation Summary
| Measurement | Hmong | Cherokee |
| Minimum | 25.7% | 10.0% |
| Maximum | 60.8% | 100.0% |
| Range | 35.1% | 90.0% |
| Mean | 46.7% | 60.5% |
| Median | 47.7% | 56.3% |
| Interquartile 25% (IQ1) | 44.4% | 50.6% |
| Interquartile 75% (IQ3) | 51.8% | 71.5% |
| Interquartile Range (IQR) | 7.4% | 20.9% |
| Standard Deviation (Sample) | 8.2% | 17.8% |
| Standard Deviation (Population) | 8.0% | 17.7% |
Similar Demographics by Disability Age Over 75
Demographics Similar to Hmong by Disability Age Over 75
In terms of disability age over 75, the demographic groups most similar to Hmong are Subsaharan African (48.2%, a difference of 0.0%), Indonesian (48.2%, a difference of 0.070%), Cree (48.2%, a difference of 0.070%), Immigrants (48.2%, a difference of 0.080%), and Taiwanese (48.2%, a difference of 0.090%).
| Demographics | Rating | Rank | Disability Age Over 75 |
| Immigrants | Liberia | 5.9 /100 | #228 | Tragic 48.1% |
| Spaniards | 5.7 /100 | #229 | Tragic 48.1% |
| Taiwanese | 4.4 /100 | #230 | Tragic 48.2% |
| Immigrants | Immigrants | 4.3 /100 | #231 | Tragic 48.2% |
| Indonesians | 4.2 /100 | #232 | Tragic 48.2% |
| Cree | 4.2 /100 | #233 | Tragic 48.2% |
| Sub-Saharan Africans | 3.8 /100 | #234 | Tragic 48.2% |
| Hmong | 3.8 /100 | #235 | Tragic 48.2% |
| Immigrants | Nicaragua | 3.2 /100 | #236 | Tragic 48.2% |
| Immigrants | St. Vincent and the Grenadines | 3.2 /100 | #237 | Tragic 48.2% |
| Nicaraguans | 3.0 /100 | #238 | Tragic 48.3% |
| Immigrants | Thailand | 2.8 /100 | #239 | Tragic 48.3% |
| Tongans | 2.3 /100 | #240 | Tragic 48.3% |
| Native Hawaiians | 2.2 /100 | #241 | Tragic 48.3% |
| French American Indians | 2.2 /100 | #242 | Tragic 48.3% |
Demographics Similar to Cherokee by Disability Age Over 75
In terms of disability age over 75, the demographic groups most similar to Cherokee are Japanese (50.2%, a difference of 0.010%), Immigrants from Dominican Republic (50.3%, a difference of 0.12%), Dominican (50.2%, a difference of 0.15%), Cape Verdean (50.1%, a difference of 0.21%), and Immigrants from Micronesia (50.1%, a difference of 0.25%).
| Demographics | Rating | Rank | Disability Age Over 75 |
| Spanish Americans | 0.0 /100 | #295 | Tragic 50.0% |
| Mexican American Indians | 0.0 /100 | #296 | Tragic 50.0% |
| Armenians | 0.0 /100 | #297 | Tragic 50.0% |
| Marshallese | 0.0 /100 | #298 | Tragic 50.1% |
| Immigrants | Micronesia | 0.0 /100 | #299 | Tragic 50.1% |
| Cape Verdeans | 0.0 /100 | #300 | Tragic 50.1% |
| Dominicans | 0.0 /100 | #301 | Tragic 50.2% |
| Cherokee | 0.0 /100 | #302 | Tragic 50.2% |
| Japanese | 0.0 /100 | #303 | Tragic 50.2% |
| Immigrants | Dominican Republic | 0.0 /100 | #304 | Tragic 50.3% |
| Central American Indians | 0.0 /100 | #305 | Tragic 50.5% |
| Immigrants | Central America | 0.0 /100 | #306 | Tragic 50.5% |
| Immigrants | Fiji | 0.0 /100 | #307 | Tragic 50.6% |
| Hispanics or Latinos | 0.0 /100 | #308 | Tragic 50.6% |
| Aleuts | 0.0 /100 | #309 | Tragic 50.6% |