Immigrants from Bulgaria vs Carpatho Rusyn Disability
COMPARE
Immigrants from Bulgaria
Carpatho Rusyn
Disability
Disability Comparison
Immigrants from Bulgaria
Carpatho Rusyns
10.9%
DISABILITY
99.7/ 100
METRIC RATING
61st/ 347
METRIC RANK
12.3%
DISABILITY
1.4/ 100
METRIC RATING
249th/ 347
METRIC RANK
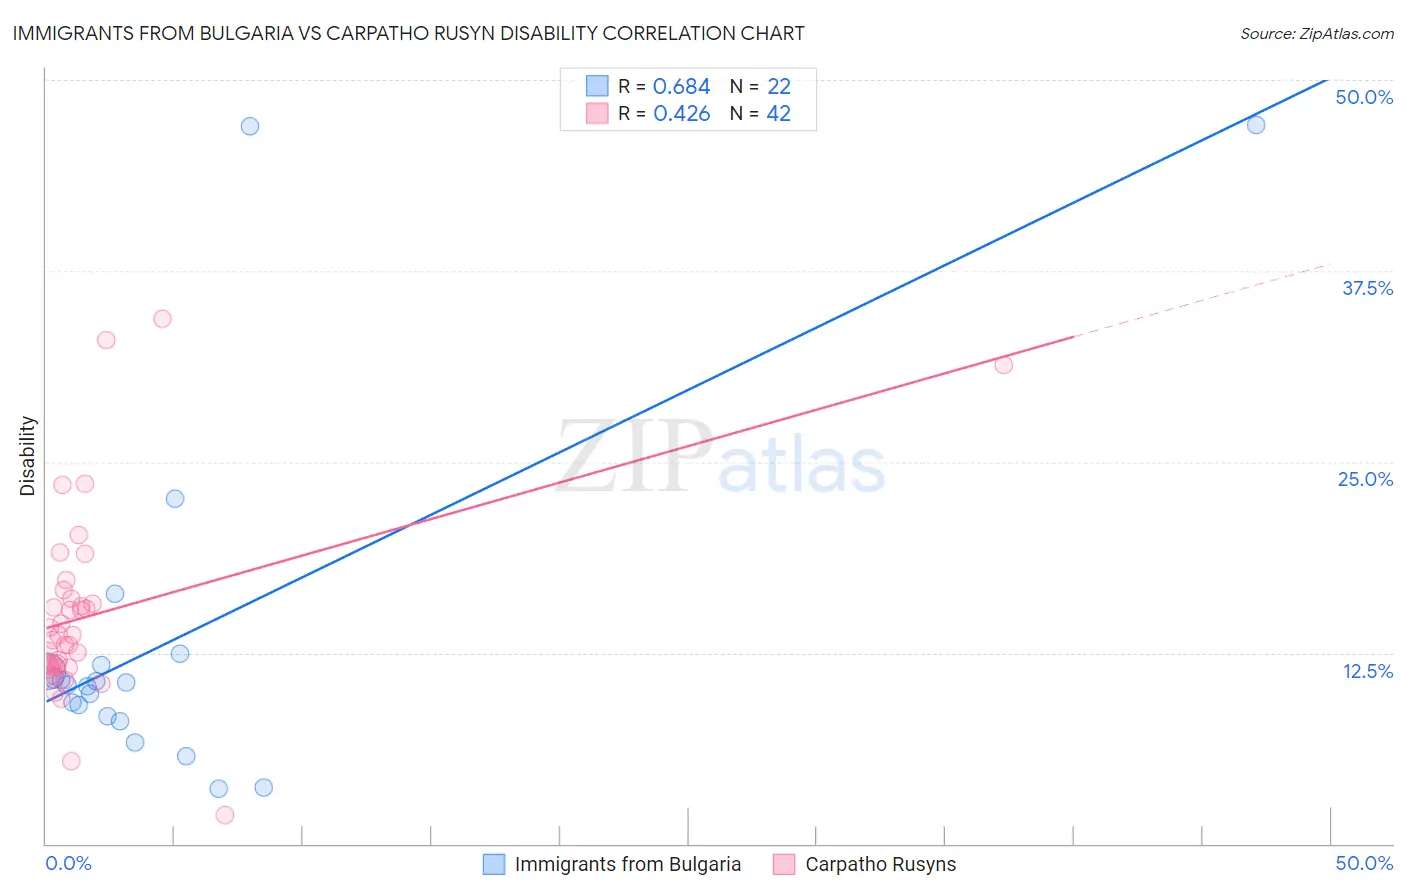
Immigrants from Bulgaria vs Carpatho Rusyn Disability Correlation Chart
The statistical analysis conducted on geographies consisting of 172,550,622 people shows a significant positive correlation between the proportion of Immigrants from Bulgaria and percentage of population with a disability in the United States with a correlation coefficient (R) of 0.684 and weighted average of 10.9%. Similarly, the statistical analysis conducted on geographies consisting of 58,872,415 people shows a moderate positive correlation between the proportion of Carpatho Rusyns and percentage of population with a disability in the United States with a correlation coefficient (R) of 0.426 and weighted average of 12.3%, a difference of 12.0%.
Disability Correlation Summary
| Measurement | Immigrants from Bulgaria | Carpatho Rusyn |
| Minimum | 3.6% | 1.9% |
| Maximum | 47.1% | 34.3% |
| Range | 43.5% | 32.4% |
| Mean | 13.5% | 15.0% |
| Median | 10.5% | 13.5% |
| Interquartile 25% (IQ1) | 8.3% | 11.6% |
| Interquartile 75% (IQ3) | 11.7% | 16.0% |
| Interquartile Range (IQR) | 3.4% | 4.4% |
| Standard Deviation (Sample) | 11.6% | 6.4% |
| Standard Deviation (Population) | 11.3% | 6.3% |
Similar Demographics by Disability
Demographics Similar to Immigrants from Bulgaria by Disability
In terms of disability, the demographic groups most similar to Immigrants from Bulgaria are Immigrants from Northern Africa (10.9%, a difference of 0.040%), Zimbabwean (10.9%, a difference of 0.060%), Immigrants from Eritrea (11.0%, a difference of 0.060%), Immigrants from Colombia (10.9%, a difference of 0.15%), and Immigrants from South America (10.9%, a difference of 0.24%).
| Demographics | Rating | Rank | Disability |
| Jordanians | 99.8 /100 | #54 | Exceptional 10.9% |
| Immigrants | El Salvador | 99.8 /100 | #55 | Exceptional 10.9% |
| Immigrants | Lithuania | 99.8 /100 | #56 | Exceptional 10.9% |
| Salvadorans | 99.8 /100 | #57 | Exceptional 10.9% |
| Immigrants | South America | 99.8 /100 | #58 | Exceptional 10.9% |
| Immigrants | Colombia | 99.7 /100 | #59 | Exceptional 10.9% |
| Zimbabweans | 99.7 /100 | #60 | Exceptional 10.9% |
| Immigrants | Bulgaria | 99.7 /100 | #61 | Exceptional 10.9% |
| Immigrants | Northern Africa | 99.7 /100 | #62 | Exceptional 10.9% |
| Immigrants | Eritrea | 99.7 /100 | #63 | Exceptional 11.0% |
| Immigrants | Sweden | 99.6 /100 | #64 | Exceptional 11.0% |
| Bulgarians | 99.6 /100 | #65 | Exceptional 11.0% |
| Laotians | 99.6 /100 | #66 | Exceptional 11.0% |
| Colombians | 99.6 /100 | #67 | Exceptional 11.0% |
| Immigrants | Afghanistan | 99.6 /100 | #68 | Exceptional 11.0% |
Demographics Similar to Carpatho Rusyns by Disability
In terms of disability, the demographic groups most similar to Carpatho Rusyns are Guamanian/Chamorro (12.3%, a difference of 0.010%), Subsaharan African (12.3%, a difference of 0.010%), European (12.3%, a difference of 0.010%), Indonesian (12.2%, a difference of 0.050%), and Swiss (12.2%, a difference of 0.080%).
| Demographics | Rating | Rank | Disability |
| Poles | 1.7 /100 | #242 | Tragic 12.2% |
| British | 1.5 /100 | #243 | Tragic 12.2% |
| Basques | 1.5 /100 | #244 | Tragic 12.2% |
| Liberians | 1.5 /100 | #245 | Tragic 12.2% |
| Swiss | 1.5 /100 | #246 | Tragic 12.2% |
| Indonesians | 1.4 /100 | #247 | Tragic 12.2% |
| Guamanians/Chamorros | 1.4 /100 | #248 | Tragic 12.3% |
| Carpatho Rusyns | 1.4 /100 | #249 | Tragic 12.3% |
| Sub-Saharan Africans | 1.4 /100 | #250 | Tragic 12.3% |
| Europeans | 1.4 /100 | #251 | Tragic 12.3% |
| Bermudans | 1.1 /100 | #252 | Tragic 12.3% |
| Belgians | 0.8 /100 | #253 | Tragic 12.3% |
| German Russians | 0.8 /100 | #254 | Tragic 12.3% |
| Slovenes | 0.6 /100 | #255 | Tragic 12.4% |
| Immigrants | Dominica | 0.6 /100 | #256 | Tragic 12.4% |