Salvadoran vs Carpatho Rusyn Disability
COMPARE
Salvadoran
Carpatho Rusyn
Disability
Disability Comparison
Salvadorans
Carpatho Rusyns
10.9%
DISABILITY
99.8/ 100
METRIC RATING
57th/ 347
METRIC RANK
12.3%
DISABILITY
1.4/ 100
METRIC RATING
249th/ 347
METRIC RANK
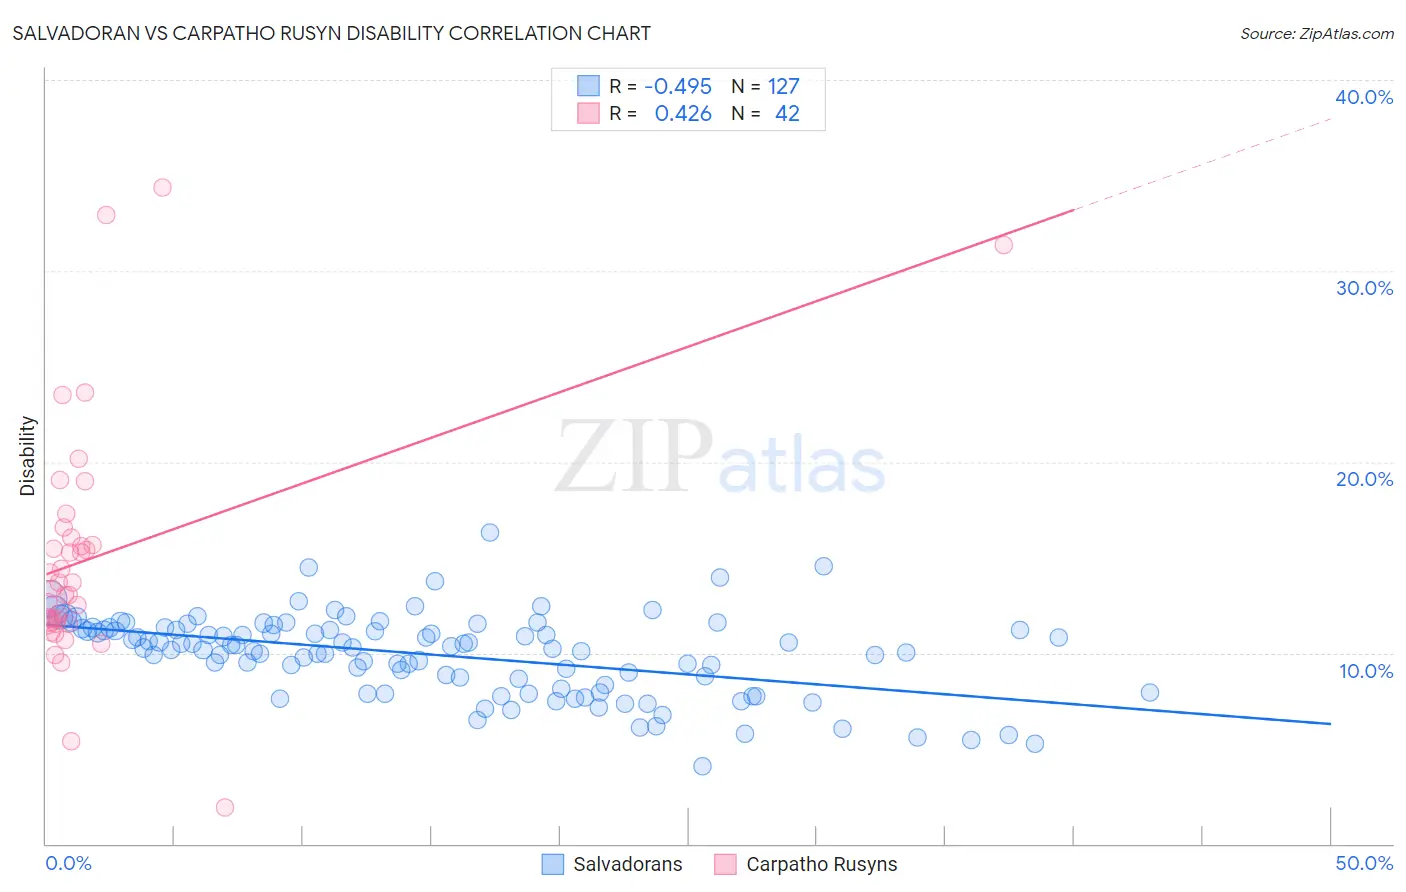
Salvadoran vs Carpatho Rusyn Disability Correlation Chart
The statistical analysis conducted on geographies consisting of 398,952,177 people shows a moderate negative correlation between the proportion of Salvadorans and percentage of population with a disability in the United States with a correlation coefficient (R) of -0.495 and weighted average of 10.9%. Similarly, the statistical analysis conducted on geographies consisting of 58,872,415 people shows a moderate positive correlation between the proportion of Carpatho Rusyns and percentage of population with a disability in the United States with a correlation coefficient (R) of 0.426 and weighted average of 12.3%, a difference of 12.3%.
Disability Correlation Summary
| Measurement | Salvadoran | Carpatho Rusyn |
| Minimum | 4.0% | 1.9% |
| Maximum | 16.3% | 34.3% |
| Range | 12.3% | 32.4% |
| Mean | 9.9% | 15.0% |
| Median | 10.3% | 13.5% |
| Interquartile 25% (IQ1) | 8.3% | 11.6% |
| Interquartile 75% (IQ3) | 11.3% | 16.0% |
| Interquartile Range (IQR) | 3.0% | 4.4% |
| Standard Deviation (Sample) | 2.1% | 6.4% |
| Standard Deviation (Population) | 2.1% | 6.3% |
Similar Demographics by Disability
Demographics Similar to Salvadorans by Disability
In terms of disability, the demographic groups most similar to Salvadorans are Immigrants from South America (10.9%, a difference of 0.030%), Immigrants from Colombia (10.9%, a difference of 0.12%), Zimbabwean (10.9%, a difference of 0.22%), Immigrants from Lithuania (10.9%, a difference of 0.24%), and Immigrants from Bulgaria (10.9%, a difference of 0.27%).
| Demographics | Rating | Rank | Disability |
| Immigrants | Saudi Arabia | 99.9 /100 | #50 | Exceptional 10.9% |
| Peruvians | 99.8 /100 | #51 | Exceptional 10.9% |
| South Americans | 99.8 /100 | #52 | Exceptional 10.9% |
| Immigrants | Spain | 99.8 /100 | #53 | Exceptional 10.9% |
| Jordanians | 99.8 /100 | #54 | Exceptional 10.9% |
| Immigrants | El Salvador | 99.8 /100 | #55 | Exceptional 10.9% |
| Immigrants | Lithuania | 99.8 /100 | #56 | Exceptional 10.9% |
| Salvadorans | 99.8 /100 | #57 | Exceptional 10.9% |
| Immigrants | South America | 99.8 /100 | #58 | Exceptional 10.9% |
| Immigrants | Colombia | 99.7 /100 | #59 | Exceptional 10.9% |
| Zimbabweans | 99.7 /100 | #60 | Exceptional 10.9% |
| Immigrants | Bulgaria | 99.7 /100 | #61 | Exceptional 10.9% |
| Immigrants | Northern Africa | 99.7 /100 | #62 | Exceptional 10.9% |
| Immigrants | Eritrea | 99.7 /100 | #63 | Exceptional 11.0% |
| Immigrants | Sweden | 99.6 /100 | #64 | Exceptional 11.0% |
Demographics Similar to Carpatho Rusyns by Disability
In terms of disability, the demographic groups most similar to Carpatho Rusyns are Guamanian/Chamorro (12.3%, a difference of 0.010%), Subsaharan African (12.3%, a difference of 0.010%), European (12.3%, a difference of 0.010%), Indonesian (12.2%, a difference of 0.050%), and Swiss (12.2%, a difference of 0.080%).
| Demographics | Rating | Rank | Disability |
| Poles | 1.7 /100 | #242 | Tragic 12.2% |
| British | 1.5 /100 | #243 | Tragic 12.2% |
| Basques | 1.5 /100 | #244 | Tragic 12.2% |
| Liberians | 1.5 /100 | #245 | Tragic 12.2% |
| Swiss | 1.5 /100 | #246 | Tragic 12.2% |
| Indonesians | 1.4 /100 | #247 | Tragic 12.2% |
| Guamanians/Chamorros | 1.4 /100 | #248 | Tragic 12.3% |
| Carpatho Rusyns | 1.4 /100 | #249 | Tragic 12.3% |
| Sub-Saharan Africans | 1.4 /100 | #250 | Tragic 12.3% |
| Europeans | 1.4 /100 | #251 | Tragic 12.3% |
| Bermudans | 1.1 /100 | #252 | Tragic 12.3% |
| Belgians | 0.8 /100 | #253 | Tragic 12.3% |
| German Russians | 0.8 /100 | #254 | Tragic 12.3% |
| Slovenes | 0.6 /100 | #255 | Tragic 12.4% |
| Immigrants | Dominica | 0.6 /100 | #256 | Tragic 12.4% |