Immigrants from Bulgaria vs French American Indian Disability
COMPARE
Immigrants from Bulgaria
French American Indian
Disability
Disability Comparison
Immigrants from Bulgaria
French American Indians
10.9%
DISABILITY
99.7/ 100
METRIC RATING
61st/ 347
METRIC RANK
13.5%
DISABILITY
0.0/ 100
METRIC RATING
308th/ 347
METRIC RANK
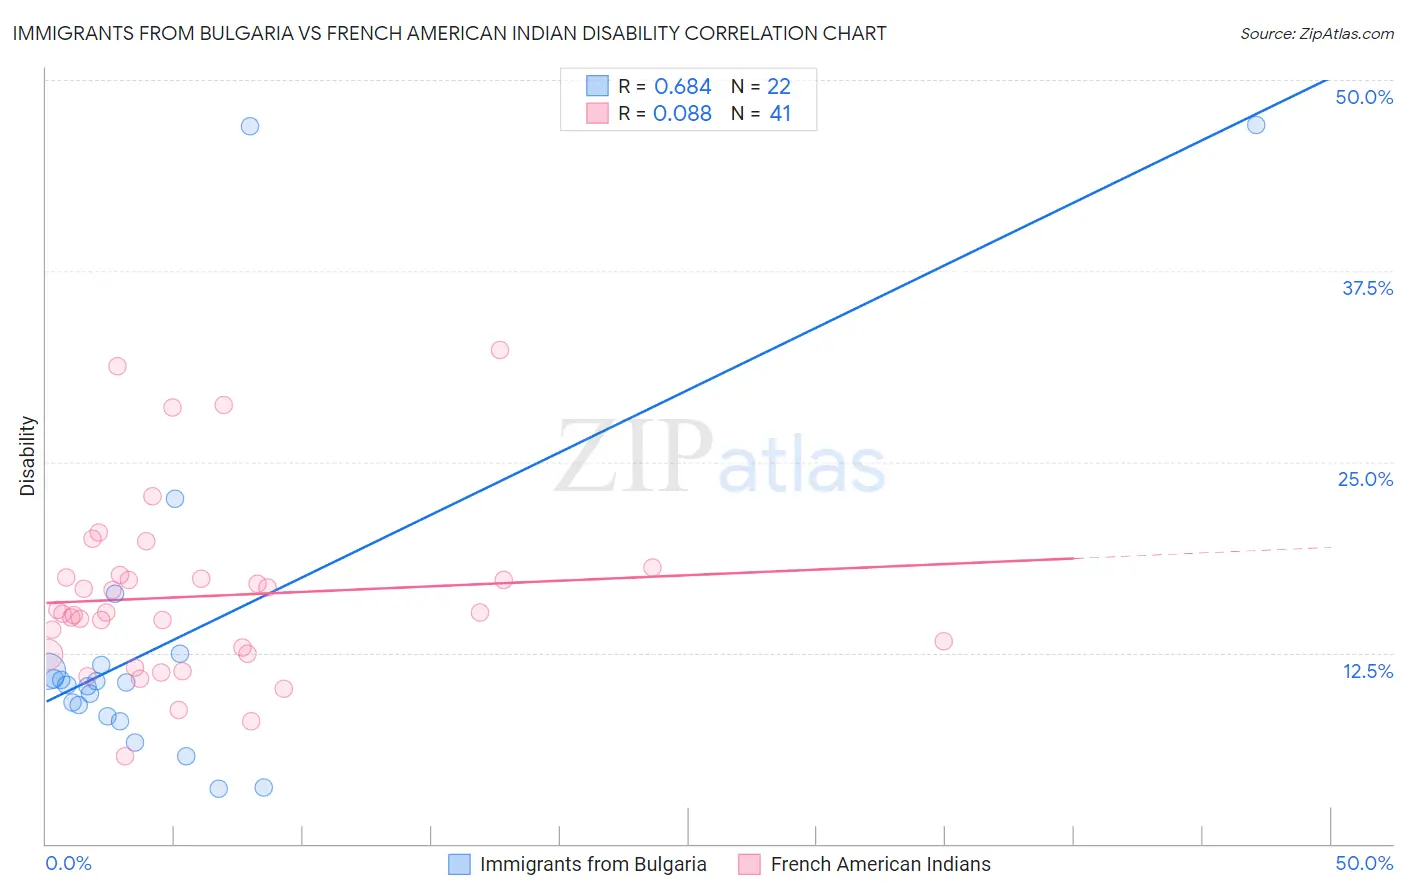
Immigrants from Bulgaria vs French American Indian Disability Correlation Chart
The statistical analysis conducted on geographies consisting of 172,550,622 people shows a significant positive correlation between the proportion of Immigrants from Bulgaria and percentage of population with a disability in the United States with a correlation coefficient (R) of 0.684 and weighted average of 10.9%. Similarly, the statistical analysis conducted on geographies consisting of 131,973,513 people shows a slight positive correlation between the proportion of French American Indians and percentage of population with a disability in the United States with a correlation coefficient (R) of 0.088 and weighted average of 13.5%, a difference of 23.6%.
Disability Correlation Summary
| Measurement | Immigrants from Bulgaria | French American Indian |
| Minimum | 3.6% | 5.7% |
| Maximum | 47.1% | 32.4% |
| Range | 43.5% | 26.7% |
| Mean | 13.5% | 16.2% |
| Median | 10.5% | 15.1% |
| Interquartile 25% (IQ1) | 8.3% | 12.4% |
| Interquartile 75% (IQ3) | 11.7% | 17.5% |
| Interquartile Range (IQR) | 3.4% | 5.1% |
| Standard Deviation (Sample) | 11.6% | 5.8% |
| Standard Deviation (Population) | 11.3% | 5.8% |
Similar Demographics by Disability
Demographics Similar to Immigrants from Bulgaria by Disability
In terms of disability, the demographic groups most similar to Immigrants from Bulgaria are Immigrants from Northern Africa (10.9%, a difference of 0.040%), Zimbabwean (10.9%, a difference of 0.060%), Immigrants from Eritrea (11.0%, a difference of 0.060%), Immigrants from Colombia (10.9%, a difference of 0.15%), and Immigrants from South America (10.9%, a difference of 0.24%).
| Demographics | Rating | Rank | Disability |
| Jordanians | 99.8 /100 | #54 | Exceptional 10.9% |
| Immigrants | El Salvador | 99.8 /100 | #55 | Exceptional 10.9% |
| Immigrants | Lithuania | 99.8 /100 | #56 | Exceptional 10.9% |
| Salvadorans | 99.8 /100 | #57 | Exceptional 10.9% |
| Immigrants | South America | 99.8 /100 | #58 | Exceptional 10.9% |
| Immigrants | Colombia | 99.7 /100 | #59 | Exceptional 10.9% |
| Zimbabweans | 99.7 /100 | #60 | Exceptional 10.9% |
| Immigrants | Bulgaria | 99.7 /100 | #61 | Exceptional 10.9% |
| Immigrants | Northern Africa | 99.7 /100 | #62 | Exceptional 10.9% |
| Immigrants | Eritrea | 99.7 /100 | #63 | Exceptional 11.0% |
| Immigrants | Sweden | 99.6 /100 | #64 | Exceptional 11.0% |
| Bulgarians | 99.6 /100 | #65 | Exceptional 11.0% |
| Laotians | 99.6 /100 | #66 | Exceptional 11.0% |
| Colombians | 99.6 /100 | #67 | Exceptional 11.0% |
| Immigrants | Afghanistan | 99.6 /100 | #68 | Exceptional 11.0% |
Demographics Similar to French American Indians by Disability
In terms of disability, the demographic groups most similar to French American Indians are Tlingit-Haida (13.5%, a difference of 0.080%), Shoshone (13.5%, a difference of 0.090%), Cape Verdean (13.5%, a difference of 0.14%), Blackfeet (13.6%, a difference of 0.61%), and Delaware (13.6%, a difference of 0.65%).
| Demographics | Rating | Rank | Disability |
| Immigrants | Micronesia | 0.0 /100 | #301 | Tragic 13.2% |
| Arapaho | 0.0 /100 | #302 | Tragic 13.2% |
| Scotch-Irish | 0.0 /100 | #303 | Tragic 13.3% |
| Yakama | 0.0 /100 | #304 | Tragic 13.4% |
| French Canadians | 0.0 /100 | #305 | Tragic 13.4% |
| Cape Verdeans | 0.0 /100 | #306 | Tragic 13.5% |
| Shoshone | 0.0 /100 | #307 | Tragic 13.5% |
| French American Indians | 0.0 /100 | #308 | Tragic 13.5% |
| Tlingit-Haida | 0.0 /100 | #309 | Tragic 13.5% |
| Blackfeet | 0.0 /100 | #310 | Tragic 13.6% |
| Delaware | 0.0 /100 | #311 | Tragic 13.6% |
| Spanish Americans | 0.0 /100 | #312 | Tragic 13.6% |
| Cree | 0.0 /100 | #313 | Tragic 13.7% |
| Blacks/African Americans | 0.0 /100 | #314 | Tragic 13.7% |
| Puget Sound Salish | 0.0 /100 | #315 | Tragic 13.7% |