Immigrants from Bolivia vs Carpatho Rusyn Disability
COMPARE
Immigrants from Bolivia
Carpatho Rusyn
Disability
Disability Comparison
Immigrants from Bolivia
Carpatho Rusyns
9.9%
DISABILITY
100.0/ 100
METRIC RATING
5th/ 347
METRIC RANK
12.3%
DISABILITY
1.4/ 100
METRIC RATING
249th/ 347
METRIC RANK
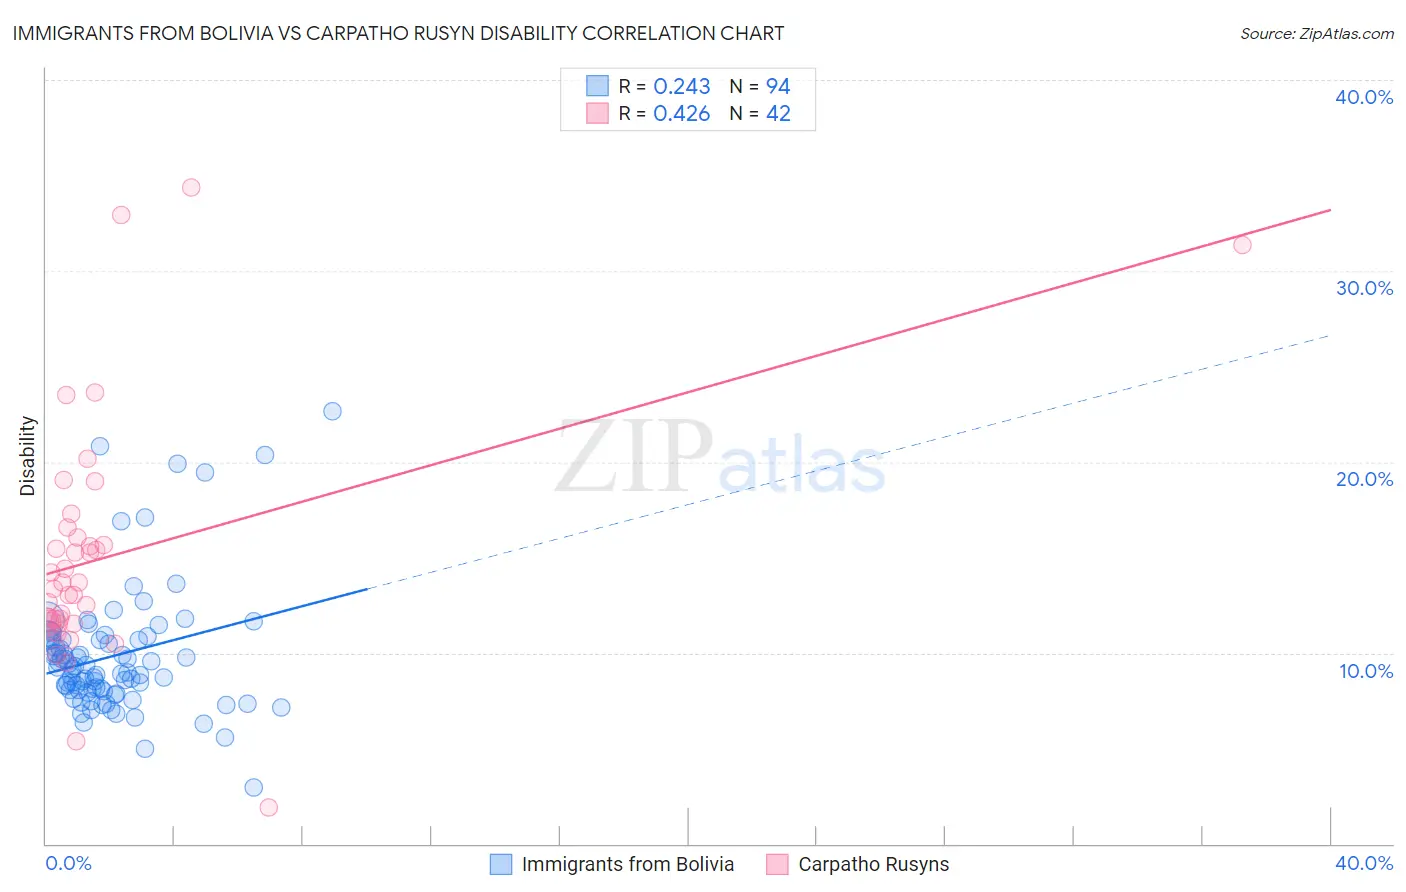
Immigrants from Bolivia vs Carpatho Rusyn Disability Correlation Chart
The statistical analysis conducted on geographies consisting of 158,717,616 people shows a weak positive correlation between the proportion of Immigrants from Bolivia and percentage of population with a disability in the United States with a correlation coefficient (R) of 0.243 and weighted average of 9.9%. Similarly, the statistical analysis conducted on geographies consisting of 58,872,415 people shows a moderate positive correlation between the proportion of Carpatho Rusyns and percentage of population with a disability in the United States with a correlation coefficient (R) of 0.426 and weighted average of 12.3%, a difference of 24.2%.
Disability Correlation Summary
| Measurement | Immigrants from Bolivia | Carpatho Rusyn |
| Minimum | 3.0% | 1.9% |
| Maximum | 22.7% | 34.3% |
| Range | 19.7% | 32.4% |
| Mean | 9.9% | 15.0% |
| Median | 9.2% | 13.5% |
| Interquartile 25% (IQ1) | 8.1% | 11.6% |
| Interquartile 75% (IQ3) | 10.7% | 16.0% |
| Interquartile Range (IQR) | 2.6% | 4.4% |
| Standard Deviation (Sample) | 3.3% | 6.4% |
| Standard Deviation (Population) | 3.3% | 6.3% |
Similar Demographics by Disability
Demographics Similar to Immigrants from Bolivia by Disability
In terms of disability, the demographic groups most similar to Immigrants from Bolivia are Immigrants from South Central Asia (9.9%, a difference of 0.84%), Immigrants from Singapore (10.0%, a difference of 1.2%), Bolivian (10.0%, a difference of 1.4%), Thai (9.7%, a difference of 1.6%), and Immigrants from Hong Kong (10.0%, a difference of 1.7%).
| Demographics | Rating | Rank | Disability |
| Immigrants | India | 100.0 /100 | #1 | Exceptional 9.5% |
| Filipinos | 100.0 /100 | #2 | Exceptional 9.6% |
| Immigrants | Taiwan | 100.0 /100 | #3 | Exceptional 9.6% |
| Thais | 100.0 /100 | #4 | Exceptional 9.7% |
| Immigrants | Bolivia | 100.0 /100 | #5 | Exceptional 9.9% |
| Immigrants | South Central Asia | 100.0 /100 | #6 | Exceptional 9.9% |
| Immigrants | Singapore | 100.0 /100 | #7 | Exceptional 10.0% |
| Bolivians | 100.0 /100 | #8 | Exceptional 10.0% |
| Immigrants | Hong Kong | 100.0 /100 | #9 | Exceptional 10.0% |
| Immigrants | China | 100.0 /100 | #10 | Exceptional 10.1% |
| Iranians | 100.0 /100 | #11 | Exceptional 10.1% |
| Immigrants | Israel | 100.0 /100 | #12 | Exceptional 10.1% |
| Immigrants | Eastern Asia | 100.0 /100 | #13 | Exceptional 10.2% |
| Immigrants | Korea | 100.0 /100 | #14 | Exceptional 10.2% |
| Okinawans | 100.0 /100 | #15 | Exceptional 10.3% |
Demographics Similar to Carpatho Rusyns by Disability
In terms of disability, the demographic groups most similar to Carpatho Rusyns are Guamanian/Chamorro (12.3%, a difference of 0.010%), Subsaharan African (12.3%, a difference of 0.010%), European (12.3%, a difference of 0.010%), Indonesian (12.2%, a difference of 0.050%), and Swiss (12.2%, a difference of 0.080%).
| Demographics | Rating | Rank | Disability |
| Poles | 1.7 /100 | #242 | Tragic 12.2% |
| British | 1.5 /100 | #243 | Tragic 12.2% |
| Basques | 1.5 /100 | #244 | Tragic 12.2% |
| Liberians | 1.5 /100 | #245 | Tragic 12.2% |
| Swiss | 1.5 /100 | #246 | Tragic 12.2% |
| Indonesians | 1.4 /100 | #247 | Tragic 12.2% |
| Guamanians/Chamorros | 1.4 /100 | #248 | Tragic 12.3% |
| Carpatho Rusyns | 1.4 /100 | #249 | Tragic 12.3% |
| Sub-Saharan Africans | 1.4 /100 | #250 | Tragic 12.3% |
| Europeans | 1.4 /100 | #251 | Tragic 12.3% |
| Bermudans | 1.1 /100 | #252 | Tragic 12.3% |
| Belgians | 0.8 /100 | #253 | Tragic 12.3% |
| German Russians | 0.8 /100 | #254 | Tragic 12.3% |
| Slovenes | 0.6 /100 | #255 | Tragic 12.4% |
| Immigrants | Dominica | 0.6 /100 | #256 | Tragic 12.4% |