Immigrants from Bulgaria vs Immigrants from Ukraine Disability
COMPARE
Immigrants from Bulgaria
Immigrants from Ukraine
Disability
Disability Comparison
Immigrants from Bulgaria
Immigrants from Ukraine
10.9%
DISABILITY
99.7/ 100
METRIC RATING
61st/ 347
METRIC RANK
11.5%
DISABILITY
77.6/ 100
METRIC RATING
147th/ 347
METRIC RANK
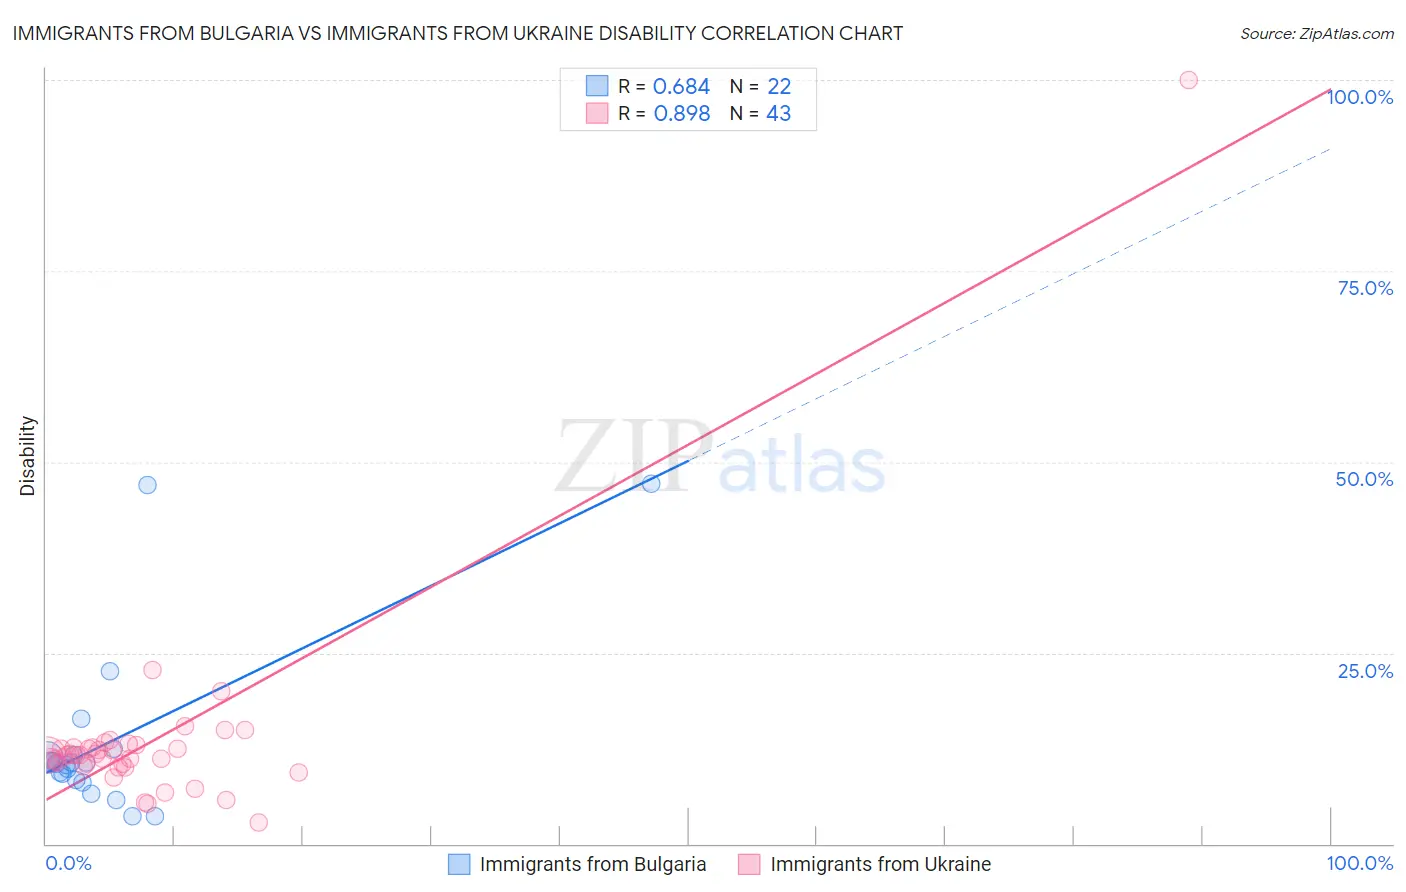
Immigrants from Bulgaria vs Immigrants from Ukraine Disability Correlation Chart
The statistical analysis conducted on geographies consisting of 172,550,622 people shows a significant positive correlation between the proportion of Immigrants from Bulgaria and percentage of population with a disability in the United States with a correlation coefficient (R) of 0.684 and weighted average of 10.9%. Similarly, the statistical analysis conducted on geographies consisting of 289,688,276 people shows a very strong positive correlation between the proportion of Immigrants from Ukraine and percentage of population with a disability in the United States with a correlation coefficient (R) of 0.898 and weighted average of 11.5%, a difference of 5.4%.
Disability Correlation Summary
| Measurement | Immigrants from Bulgaria | Immigrants from Ukraine |
| Minimum | 3.6% | 2.9% |
| Maximum | 47.1% | 100.0% |
| Range | 43.5% | 97.1% |
| Mean | 13.5% | 13.4% |
| Median | 10.5% | 11.7% |
| Interquartile 25% (IQ1) | 8.3% | 10.2% |
| Interquartile 75% (IQ3) | 11.7% | 12.7% |
| Interquartile Range (IQR) | 3.4% | 2.5% |
| Standard Deviation (Sample) | 11.6% | 14.0% |
| Standard Deviation (Population) | 11.3% | 13.8% |
Similar Demographics by Disability
Demographics Similar to Immigrants from Bulgaria by Disability
In terms of disability, the demographic groups most similar to Immigrants from Bulgaria are Immigrants from Northern Africa (10.9%, a difference of 0.040%), Zimbabwean (10.9%, a difference of 0.060%), Immigrants from Eritrea (11.0%, a difference of 0.060%), Immigrants from Colombia (10.9%, a difference of 0.15%), and Immigrants from South America (10.9%, a difference of 0.24%).
| Demographics | Rating | Rank | Disability |
| Jordanians | 99.8 /100 | #54 | Exceptional 10.9% |
| Immigrants | El Salvador | 99.8 /100 | #55 | Exceptional 10.9% |
| Immigrants | Lithuania | 99.8 /100 | #56 | Exceptional 10.9% |
| Salvadorans | 99.8 /100 | #57 | Exceptional 10.9% |
| Immigrants | South America | 99.8 /100 | #58 | Exceptional 10.9% |
| Immigrants | Colombia | 99.7 /100 | #59 | Exceptional 10.9% |
| Zimbabweans | 99.7 /100 | #60 | Exceptional 10.9% |
| Immigrants | Bulgaria | 99.7 /100 | #61 | Exceptional 10.9% |
| Immigrants | Northern Africa | 99.7 /100 | #62 | Exceptional 10.9% |
| Immigrants | Eritrea | 99.7 /100 | #63 | Exceptional 11.0% |
| Immigrants | Sweden | 99.6 /100 | #64 | Exceptional 11.0% |
| Bulgarians | 99.6 /100 | #65 | Exceptional 11.0% |
| Laotians | 99.6 /100 | #66 | Exceptional 11.0% |
| Colombians | 99.6 /100 | #67 | Exceptional 11.0% |
| Immigrants | Afghanistan | 99.6 /100 | #68 | Exceptional 11.0% |
Demographics Similar to Immigrants from Ukraine by Disability
In terms of disability, the demographic groups most similar to Immigrants from Ukraine are Sudanese (11.5%, a difference of 0.030%), Immigrants from Hungary (11.5%, a difference of 0.090%), Nigerian (11.5%, a difference of 0.26%), Immigrants from Norway (11.6%, a difference of 0.27%), and Romanian (11.6%, a difference of 0.30%).
| Demographics | Rating | Rank | Disability |
| Russians | 86.8 /100 | #140 | Excellent 11.5% |
| Immigrants | Grenada | 86.1 /100 | #141 | Excellent 11.5% |
| Immigrants | Sudan | 85.3 /100 | #142 | Excellent 11.5% |
| Moroccans | 83.3 /100 | #143 | Excellent 11.5% |
| Australians | 82.5 /100 | #144 | Excellent 11.5% |
| Nigerians | 81.3 /100 | #145 | Excellent 11.5% |
| Immigrants | Hungary | 79.0 /100 | #146 | Good 11.5% |
| Immigrants | Ukraine | 77.6 /100 | #147 | Good 11.5% |
| Sudanese | 77.1 /100 | #148 | Good 11.5% |
| Immigrants | Norway | 73.2 /100 | #149 | Good 11.6% |
| Romanians | 72.7 /100 | #150 | Good 11.6% |
| Immigrants | Kenya | 72.1 /100 | #151 | Good 11.6% |
| Immigrants | Moldova | 72.0 /100 | #152 | Good 11.6% |
| Immigrants | Ghana | 71.2 /100 | #153 | Good 11.6% |
| Immigrants | Guatemala | 71.1 /100 | #154 | Good 11.6% |