Immigrants from Bulgaria vs Immigrants from Portugal Disability
COMPARE
Immigrants from Bulgaria
Immigrants from Portugal
Disability
Disability Comparison
Immigrants from Bulgaria
Immigrants from Portugal
10.9%
DISABILITY
99.7/ 100
METRIC RATING
61st/ 347
METRIC RANK
12.9%
DISABILITY
0.0/ 100
METRIC RATING
281st/ 347
METRIC RANK
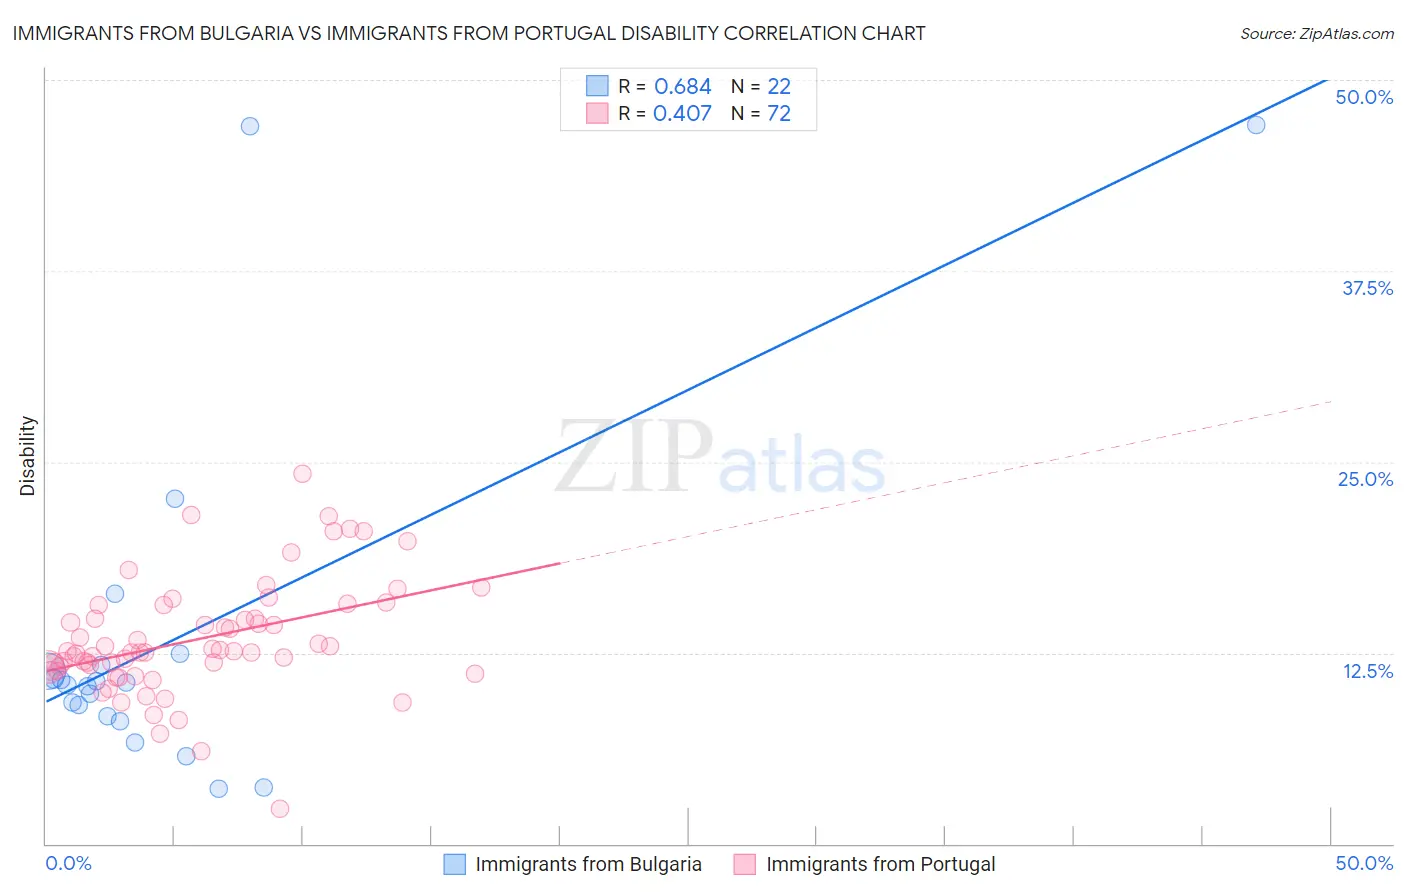
Immigrants from Bulgaria vs Immigrants from Portugal Disability Correlation Chart
The statistical analysis conducted on geographies consisting of 172,550,622 people shows a significant positive correlation between the proportion of Immigrants from Bulgaria and percentage of population with a disability in the United States with a correlation coefficient (R) of 0.684 and weighted average of 10.9%. Similarly, the statistical analysis conducted on geographies consisting of 174,786,483 people shows a moderate positive correlation between the proportion of Immigrants from Portugal and percentage of population with a disability in the United States with a correlation coefficient (R) of 0.407 and weighted average of 12.9%, a difference of 17.5%.
Disability Correlation Summary
| Measurement | Immigrants from Bulgaria | Immigrants from Portugal |
| Minimum | 3.6% | 2.3% |
| Maximum | 47.1% | 24.2% |
| Range | 43.5% | 21.9% |
| Mean | 13.5% | 13.4% |
| Median | 10.5% | 12.6% |
| Interquartile 25% (IQ1) | 8.3% | 11.4% |
| Interquartile 75% (IQ3) | 11.7% | 15.2% |
| Interquartile Range (IQR) | 3.4% | 3.7% |
| Standard Deviation (Sample) | 11.6% | 3.8% |
| Standard Deviation (Population) | 11.3% | 3.7% |
Similar Demographics by Disability
Demographics Similar to Immigrants from Bulgaria by Disability
In terms of disability, the demographic groups most similar to Immigrants from Bulgaria are Immigrants from Northern Africa (10.9%, a difference of 0.040%), Zimbabwean (10.9%, a difference of 0.060%), Immigrants from Eritrea (11.0%, a difference of 0.060%), Immigrants from Colombia (10.9%, a difference of 0.15%), and Immigrants from South America (10.9%, a difference of 0.24%).
| Demographics | Rating | Rank | Disability |
| Jordanians | 99.8 /100 | #54 | Exceptional 10.9% |
| Immigrants | El Salvador | 99.8 /100 | #55 | Exceptional 10.9% |
| Immigrants | Lithuania | 99.8 /100 | #56 | Exceptional 10.9% |
| Salvadorans | 99.8 /100 | #57 | Exceptional 10.9% |
| Immigrants | South America | 99.8 /100 | #58 | Exceptional 10.9% |
| Immigrants | Colombia | 99.7 /100 | #59 | Exceptional 10.9% |
| Zimbabweans | 99.7 /100 | #60 | Exceptional 10.9% |
| Immigrants | Bulgaria | 99.7 /100 | #61 | Exceptional 10.9% |
| Immigrants | Northern Africa | 99.7 /100 | #62 | Exceptional 10.9% |
| Immigrants | Eritrea | 99.7 /100 | #63 | Exceptional 11.0% |
| Immigrants | Sweden | 99.6 /100 | #64 | Exceptional 11.0% |
| Bulgarians | 99.6 /100 | #65 | Exceptional 11.0% |
| Laotians | 99.6 /100 | #66 | Exceptional 11.0% |
| Colombians | 99.6 /100 | #67 | Exceptional 11.0% |
| Immigrants | Afghanistan | 99.6 /100 | #68 | Exceptional 11.0% |
Demographics Similar to Immigrants from Portugal by Disability
In terms of disability, the demographic groups most similar to Immigrants from Portugal are Spanish (12.8%, a difference of 0.14%), Scottish (12.9%, a difference of 0.14%), Irish (12.9%, a difference of 0.16%), Fijian (12.8%, a difference of 0.19%), and German (12.8%, a difference of 0.29%).
| Demographics | Rating | Rank | Disability |
| Nepalese | 0.0 /100 | #274 | Tragic 12.8% |
| Sioux | 0.0 /100 | #275 | Tragic 12.8% |
| Hmong | 0.0 /100 | #276 | Tragic 12.8% |
| Dutch | 0.0 /100 | #277 | Tragic 12.8% |
| Germans | 0.0 /100 | #278 | Tragic 12.8% |
| Fijians | 0.0 /100 | #279 | Tragic 12.8% |
| Spanish | 0.0 /100 | #280 | Tragic 12.8% |
| Immigrants | Portugal | 0.0 /100 | #281 | Tragic 12.9% |
| Scottish | 0.0 /100 | #282 | Tragic 12.9% |
| Irish | 0.0 /100 | #283 | Tragic 12.9% |
| Welsh | 0.0 /100 | #284 | Tragic 12.9% |
| Crow | 0.0 /100 | #285 | Tragic 12.9% |
| English | 0.0 /100 | #286 | Tragic 13.0% |
| Africans | 0.0 /100 | #287 | Tragic 13.0% |
| Whites/Caucasians | 0.0 /100 | #288 | Tragic 13.0% |