Immigrants from Cabo Verde vs Carpatho Rusyn Disability
COMPARE
Immigrants from Cabo Verde
Carpatho Rusyn
Disability
Disability Comparison
Immigrants from Cabo Verde
Carpatho Rusyns
13.7%
DISABILITY
0.0/ 100
METRIC RATING
317th/ 347
METRIC RANK
12.3%
DISABILITY
1.4/ 100
METRIC RATING
249th/ 347
METRIC RANK
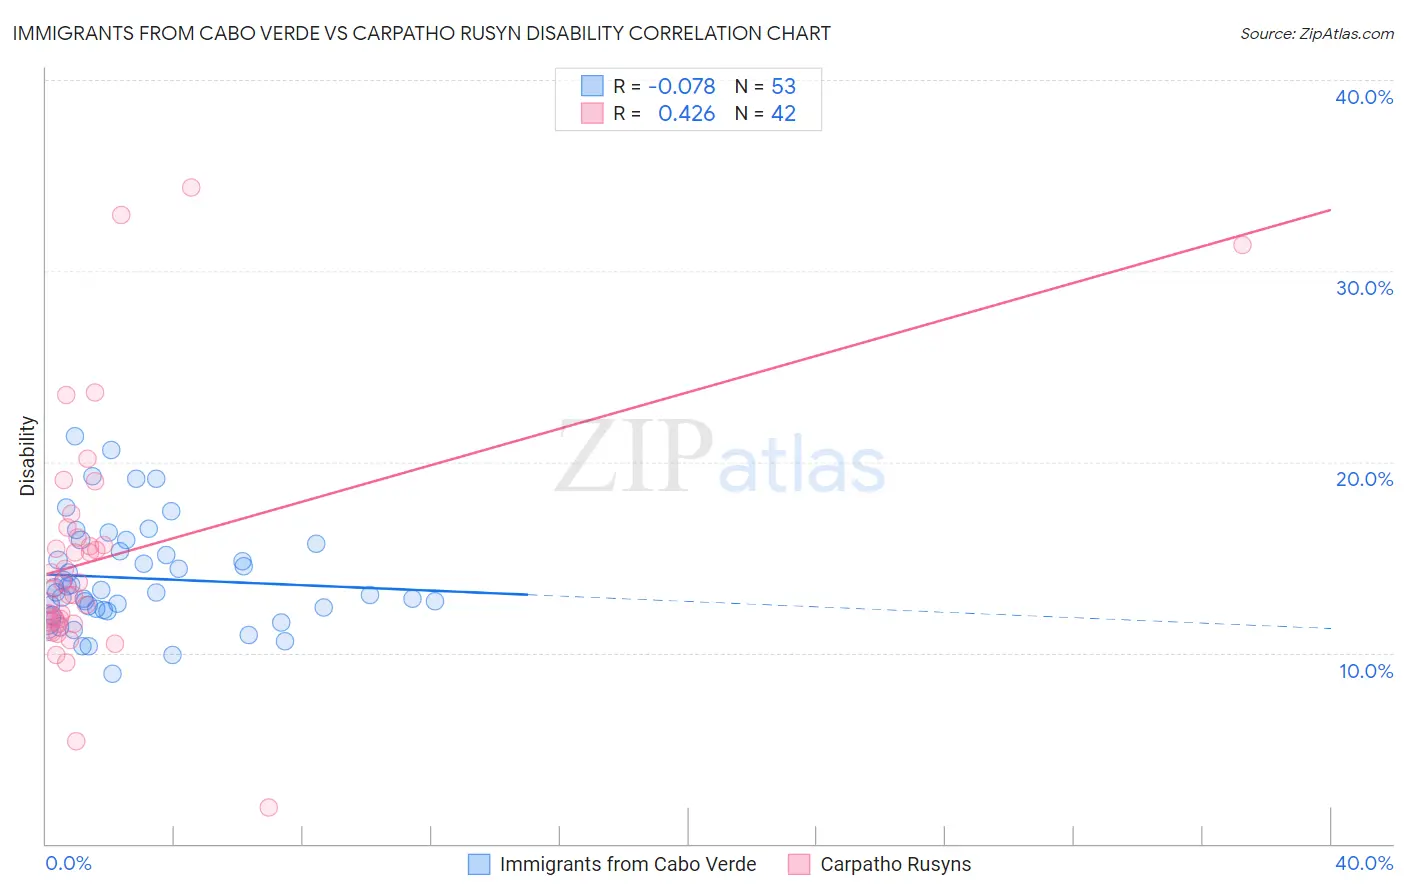
Immigrants from Cabo Verde vs Carpatho Rusyn Disability Correlation Chart
The statistical analysis conducted on geographies consisting of 38,149,836 people shows a slight negative correlation between the proportion of Immigrants from Cabo Verde and percentage of population with a disability in the United States with a correlation coefficient (R) of -0.078 and weighted average of 13.7%. Similarly, the statistical analysis conducted on geographies consisting of 58,872,415 people shows a moderate positive correlation between the proportion of Carpatho Rusyns and percentage of population with a disability in the United States with a correlation coefficient (R) of 0.426 and weighted average of 12.3%, a difference of 11.8%.
Disability Correlation Summary
| Measurement | Immigrants from Cabo Verde | Carpatho Rusyn |
| Minimum | 8.9% | 1.9% |
| Maximum | 21.3% | 34.3% |
| Range | 12.4% | 32.4% |
| Mean | 13.9% | 15.0% |
| Median | 13.1% | 13.5% |
| Interquartile 25% (IQ1) | 12.2% | 11.6% |
| Interquartile 75% (IQ3) | 15.5% | 16.0% |
| Interquartile Range (IQR) | 3.3% | 4.4% |
| Standard Deviation (Sample) | 2.7% | 6.4% |
| Standard Deviation (Population) | 2.7% | 6.3% |
Similar Demographics by Disability
Demographics Similar to Immigrants from Cabo Verde by Disability
In terms of disability, the demographic groups most similar to Immigrants from Cabo Verde are Pima (13.7%, a difference of 0.0%), Black/African American (13.7%, a difference of 0.030%), Puget Sound Salish (13.7%, a difference of 0.030%), Cree (13.7%, a difference of 0.070%), and Spanish American (13.6%, a difference of 0.42%).
| Demographics | Rating | Rank | Disability |
| Blackfeet | 0.0 /100 | #310 | Tragic 13.6% |
| Delaware | 0.0 /100 | #311 | Tragic 13.6% |
| Spanish Americans | 0.0 /100 | #312 | Tragic 13.6% |
| Cree | 0.0 /100 | #313 | Tragic 13.7% |
| Blacks/African Americans | 0.0 /100 | #314 | Tragic 13.7% |
| Puget Sound Salish | 0.0 /100 | #315 | Tragic 13.7% |
| Pima | 0.0 /100 | #316 | Tragic 13.7% |
| Immigrants | Cabo Verde | 0.0 /100 | #317 | Tragic 13.7% |
| Menominee | 0.0 /100 | #318 | Tragic 13.8% |
| Iroquois | 0.0 /100 | #319 | Tragic 13.8% |
| Apache | 0.0 /100 | #320 | Tragic 13.9% |
| Paiute | 0.0 /100 | #321 | Tragic 13.9% |
| Americans | 0.0 /100 | #322 | Tragic 13.9% |
| Comanche | 0.0 /100 | #323 | Tragic 14.1% |
| Chippewa | 0.0 /100 | #324 | Tragic 14.1% |
Demographics Similar to Carpatho Rusyns by Disability
In terms of disability, the demographic groups most similar to Carpatho Rusyns are Guamanian/Chamorro (12.3%, a difference of 0.010%), Subsaharan African (12.3%, a difference of 0.010%), European (12.3%, a difference of 0.010%), Indonesian (12.2%, a difference of 0.050%), and Swiss (12.2%, a difference of 0.080%).
| Demographics | Rating | Rank | Disability |
| Poles | 1.7 /100 | #242 | Tragic 12.2% |
| British | 1.5 /100 | #243 | Tragic 12.2% |
| Basques | 1.5 /100 | #244 | Tragic 12.2% |
| Liberians | 1.5 /100 | #245 | Tragic 12.2% |
| Swiss | 1.5 /100 | #246 | Tragic 12.2% |
| Indonesians | 1.4 /100 | #247 | Tragic 12.2% |
| Guamanians/Chamorros | 1.4 /100 | #248 | Tragic 12.3% |
| Carpatho Rusyns | 1.4 /100 | #249 | Tragic 12.3% |
| Sub-Saharan Africans | 1.4 /100 | #250 | Tragic 12.3% |
| Europeans | 1.4 /100 | #251 | Tragic 12.3% |
| Bermudans | 1.1 /100 | #252 | Tragic 12.3% |
| Belgians | 0.8 /100 | #253 | Tragic 12.3% |
| German Russians | 0.8 /100 | #254 | Tragic 12.3% |
| Slovenes | 0.6 /100 | #255 | Tragic 12.4% |
| Immigrants | Dominica | 0.6 /100 | #256 | Tragic 12.4% |