Immigrants from Bulgaria vs Okinawan Disability
COMPARE
Immigrants from Bulgaria
Okinawan
Disability
Disability Comparison
Immigrants from Bulgaria
Okinawans
10.9%
DISABILITY
99.7/ 100
METRIC RATING
61st/ 347
METRIC RANK
10.3%
DISABILITY
100.0/ 100
METRIC RATING
15th/ 347
METRIC RANK
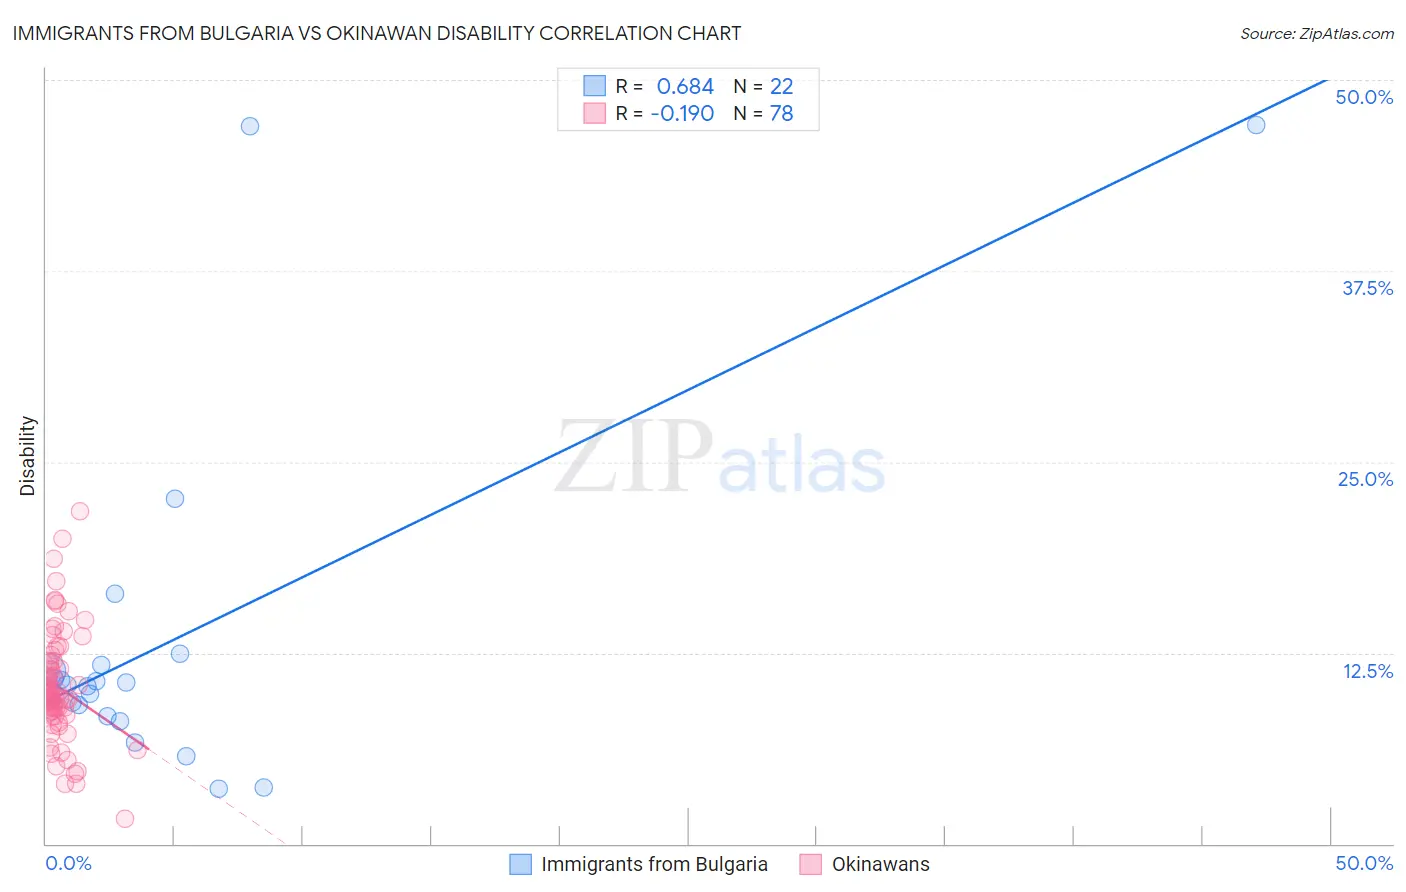
Immigrants from Bulgaria vs Okinawan Disability Correlation Chart
The statistical analysis conducted on geographies consisting of 172,550,622 people shows a significant positive correlation between the proportion of Immigrants from Bulgaria and percentage of population with a disability in the United States with a correlation coefficient (R) of 0.684 and weighted average of 10.9%. Similarly, the statistical analysis conducted on geographies consisting of 73,770,333 people shows a poor negative correlation between the proportion of Okinawans and percentage of population with a disability in the United States with a correlation coefficient (R) of -0.190 and weighted average of 10.3%, a difference of 6.7%.
Disability Correlation Summary
| Measurement | Immigrants from Bulgaria | Okinawan |
| Minimum | 3.6% | 1.6% |
| Maximum | 47.1% | 21.8% |
| Range | 43.5% | 20.2% |
| Mean | 13.5% | 10.3% |
| Median | 10.5% | 9.6% |
| Interquartile 25% (IQ1) | 8.3% | 8.6% |
| Interquartile 75% (IQ3) | 11.7% | 11.9% |
| Interquartile Range (IQR) | 3.4% | 3.3% |
| Standard Deviation (Sample) | 11.6% | 3.6% |
| Standard Deviation (Population) | 11.3% | 3.6% |
Similar Demographics by Disability
Demographics Similar to Immigrants from Bulgaria by Disability
In terms of disability, the demographic groups most similar to Immigrants from Bulgaria are Immigrants from Northern Africa (10.9%, a difference of 0.040%), Zimbabwean (10.9%, a difference of 0.060%), Immigrants from Eritrea (11.0%, a difference of 0.060%), Immigrants from Colombia (10.9%, a difference of 0.15%), and Immigrants from South America (10.9%, a difference of 0.24%).
| Demographics | Rating | Rank | Disability |
| Jordanians | 99.8 /100 | #54 | Exceptional 10.9% |
| Immigrants | El Salvador | 99.8 /100 | #55 | Exceptional 10.9% |
| Immigrants | Lithuania | 99.8 /100 | #56 | Exceptional 10.9% |
| Salvadorans | 99.8 /100 | #57 | Exceptional 10.9% |
| Immigrants | South America | 99.8 /100 | #58 | Exceptional 10.9% |
| Immigrants | Colombia | 99.7 /100 | #59 | Exceptional 10.9% |
| Zimbabweans | 99.7 /100 | #60 | Exceptional 10.9% |
| Immigrants | Bulgaria | 99.7 /100 | #61 | Exceptional 10.9% |
| Immigrants | Northern Africa | 99.7 /100 | #62 | Exceptional 10.9% |
| Immigrants | Eritrea | 99.7 /100 | #63 | Exceptional 11.0% |
| Immigrants | Sweden | 99.6 /100 | #64 | Exceptional 11.0% |
| Bulgarians | 99.6 /100 | #65 | Exceptional 11.0% |
| Laotians | 99.6 /100 | #66 | Exceptional 11.0% |
| Colombians | 99.6 /100 | #67 | Exceptional 11.0% |
| Immigrants | Afghanistan | 99.6 /100 | #68 | Exceptional 11.0% |
Demographics Similar to Okinawans by Disability
In terms of disability, the demographic groups most similar to Okinawans are Indian (Asian) (10.3%, a difference of 0.070%), Immigrants from Iran (10.3%, a difference of 0.13%), Immigrants from Korea (10.2%, a difference of 0.31%), Immigrants from Eastern Asia (10.2%, a difference of 0.91%), and Immigrants from Israel (10.1%, a difference of 1.1%).
| Demographics | Rating | Rank | Disability |
| Bolivians | 100.0 /100 | #8 | Exceptional 10.0% |
| Immigrants | Hong Kong | 100.0 /100 | #9 | Exceptional 10.0% |
| Immigrants | China | 100.0 /100 | #10 | Exceptional 10.1% |
| Iranians | 100.0 /100 | #11 | Exceptional 10.1% |
| Immigrants | Israel | 100.0 /100 | #12 | Exceptional 10.1% |
| Immigrants | Eastern Asia | 100.0 /100 | #13 | Exceptional 10.2% |
| Immigrants | Korea | 100.0 /100 | #14 | Exceptional 10.2% |
| Okinawans | 100.0 /100 | #15 | Exceptional 10.3% |
| Indians (Asian) | 100.0 /100 | #16 | Exceptional 10.3% |
| Immigrants | Iran | 100.0 /100 | #17 | Exceptional 10.3% |
| Burmese | 100.0 /100 | #18 | Exceptional 10.4% |
| Immigrants | Pakistan | 100.0 /100 | #19 | Exceptional 10.4% |
| Immigrants | Venezuela | 100.0 /100 | #20 | Exceptional 10.4% |
| Asians | 100.0 /100 | #21 | Exceptional 10.4% |
| Immigrants | Sri Lanka | 100.0 /100 | #22 | Exceptional 10.5% |