Immigrants from Brazil vs Soviet Union Hearing Disability

COMPARE

Immigrants from Brazil
Race
Ancestry
AfghanAfricanAlaska NativeAlaskan AthabascanAlbanianAleutAlsatianAmericanApacheArabArapahoArgentineanArmenianAssyrian/Chaldean/SyriacAustralianAustrianBahamianBangladeshiBarbadianBasqueBelgianBelizeanBermudanBhutaneseBlackfeetBolivianBrazilianBritishBritish West IndianBulgarianBurmeseCajunCambodianCanadianCape VerdeanCarpatho RusynCelticCentral AmericanCentral American IndianCherokeeCheyenneChickasawChileanChineseChippewaChoctawColombianColvilleComancheCosta RicanCreeCreekCroatianCrowCubanCypriotCzechCzechoslovakianDanishDelawareDominicanDutchDutch West IndianEastern EuropeanEcuadorianEgyptianEnglishEstonianEthiopianEuropeanFijianFilipinoFinnishFrenchFrench American IndianFrench CanadianGermanGerman RussianGhanaianGreekGuamanian/ChamorroGuatemalanGuyaneseHaitianHmongHonduranHopiHoumaHungarianIcelanderIndian (Asian)IndonesianInupiatIranianIraqiIrishIroquoisIsraeliItalianJamaicanJapaneseJordanianKenyanKiowaKoreanLaotianLatvianLebaneseLiberianLithuanianLumbeeLuxembourgerMacedonianMalaysianMalteseMarshalleseMenomineeMexicanMexican American IndianMongolianMoroccanNative HawaiianNavajoNepaleseNew ZealanderNicaraguanNigerianNorthern EuropeanNorwegianOkinawanOsageOttawaPaiutePakistaniPalestinianPanamanianParaguayanPennsylvania GermanPeruvianPimaPolishPortuguesePotawatomiPuebloPuerto RicanPuget Sound SalishRomanianRussianSalvadoranSamoanScandinavianScotch-IrishScottishSeminoleSenegaleseSerbianShoshoneSierra LeoneanSiouxSlavicSlovakSloveneSomaliSouth AfricanSouth AmericanSouth American IndianSpaniardSpanishSpanish AmericanSpanish American IndianSri LankanSubsaharan AfricanSudaneseSwedishSwissSyrianTaiwaneseThaiTlingit-HaidaTohono O'OdhamTonganTrinidadian and TobagonianTsimshianTurkishU.S. Virgin IslanderUgandanUkrainianUruguayanUteVenezuelanVietnameseWelshWest IndianYakamaYaquiYugoslavianYumanYup'ikZimbabwean
Immigration
NonimmigrantsImmigrantsAfghanistanAfricaAlbaniaArgentinaArmeniaAsiaAustraliaAustriaBahamasBangladeshBarbadosBelarusBelgiumBelizeBoliviaBosnia and HerzegovinaBrazilBulgariaBurma/MyanmarCabo VerdeCambodiaCameroonCanadaCaribbeanCentral AmericaChileChinaColombiaCongoCosta RicaCroatiaCubaCzechoslovakiaDenmarkDominicaDominican RepublicEastern AfricaEastern AsiaEastern EuropeEcuadorEgyptEl SalvadorEnglandEritreaEthiopiaEuropeFijiFranceGermanyGhanaGreeceGrenadaGuatemalaGuyanaHaitiHondurasHong KongHungaryIndiaIndonesiaIranIraqIrelandIsraelItalyJamaicaJapanJordanKazakhstanKenyaKoreaKuwaitLaosLatin AmericaLatviaLebanonLiberiaLithuaniaMalaysiaMexicoMicronesiaMiddle AfricaMoldovaMoroccoNepalNetherlandsNicaraguaNigeriaNorth AmericaNorth MacedoniaNorthern AfricaNorthern EuropeNorwayOceaniaPakistanPanamaPeruPhilippinesPolandPortugalRomaniaRussiaSaudi ArabiaScotlandSenegalSerbiaSierra LeoneSingaporeSomaliaSouth AfricaSouth AmericaSouth Central AsiaSouth Eastern AsiaSouthern EuropeSpainSri LankaSt. Vincent and the GrenadinesSudanSwedenSwitzerlandSyriaTaiwanThailandTrinidad and TobagoTurkeyUgandaUkraineUruguayUzbekistanVenezuelaVietnamWest IndiesWestern AfricaWestern AsiaWestern EuropeYemenZaireZimbabweAzores
Soviet Union
Race
Ancestry
AfghanAfricanAlaska NativeAlaskan AthabascanAlbanianAleutAlsatianAmericanApacheArabArapahoArgentineanArmenianAssyrian/Chaldean/SyriacAustralianAustrianBahamianBangladeshiBarbadianBasqueBelgianBelizeanBermudanBhutaneseBlackfeetBolivianBrazilianBritishBritish West IndianBulgarianBurmeseCajunCambodianCanadianCape VerdeanCarpatho RusynCelticCentral AmericanCentral American IndianCherokeeCheyenneChickasawChileanChineseChippewaChoctawColombianColvilleComancheCosta RicanCreeCreekCroatianCrowCubanCypriotCzechCzechoslovakianDanishDelawareDominicanDutchDutch West IndianEastern EuropeanEcuadorianEgyptianEnglishEstonianEthiopianEuropeanFijianFilipinoFinnishFrenchFrench American IndianFrench CanadianGermanGerman RussianGhanaianGreekGuamanian/ChamorroGuatemalanGuyaneseHaitianHmongHonduranHopiHoumaHungarianIcelanderIndian (Asian)IndonesianInupiatIranianIraqiIrishIroquoisIsraeliItalianJamaicanJapaneseJordanianKenyanKiowaKoreanLaotianLatvianLebaneseLiberianLithuanianLumbeeLuxembourgerMacedonianMalaysianMalteseMarshalleseMenomineeMexicanMexican American IndianMongolianMoroccanNative HawaiianNavajoNepaleseNew ZealanderNicaraguanNigerianNorthern EuropeanNorwegianOkinawanOsageOttawaPaiutePakistaniPalestinianPanamanianParaguayanPennsylvania GermanPeruvianPimaPolishPortuguesePotawatomiPuebloPuerto RicanPuget Sound SalishRomanianRussianSalvadoranSamoanScandinavianScotch-IrishScottishSeminoleSenegaleseSerbianShoshoneSierra LeoneanSiouxSlavicSlovakSloveneSomaliSouth AfricanSouth AmericanSouth American IndianSoviet UnionSpaniardSpanishSpanish AmericanSpanish American IndianSri LankanSubsaharan AfricanSudaneseSwedishSwissSyrianTaiwaneseThaiTlingit-HaidaTohono O'OdhamTonganTrinidadian and TobagonianTsimshianTurkishU.S. Virgin IslanderUgandanUkrainianUruguayanUteVenezuelanVietnameseWelshWest IndianYakamaYaquiYugoslavianYumanYup'ikZimbabwean
Immigration
NonimmigrantsImmigrantsAfghanistanAfricaAlbaniaArgentinaArmeniaAsiaAustraliaAustriaBahamasBangladeshBarbadosBelarusBelgiumBelizeBoliviaBosnia and HerzegovinaBulgariaBurma/MyanmarCabo VerdeCambodiaCameroonCanadaCaribbeanCentral AmericaChileChinaColombiaCongoCosta RicaCroatiaCubaCzechoslovakiaDenmarkDominicaDominican RepublicEastern AfricaEastern AsiaEastern EuropeEcuadorEgyptEl SalvadorEnglandEritreaEthiopiaEuropeFijiFranceGermanyGhanaGreeceGrenadaGuatemalaGuyanaHaitiHondurasHong KongHungaryIndiaIndonesiaIranIraqIrelandIsraelItalyJamaicaJapanJordanKazakhstanKenyaKoreaKuwaitLaosLatin AmericaLatviaLebanonLiberiaLithuaniaMalaysiaMexicoMicronesiaMiddle AfricaMoldovaMoroccoNepalNetherlandsNicaraguaNigeriaNorth AmericaNorth MacedoniaNorthern AfricaNorthern EuropeNorwayOceaniaPakistanPanamaPeruPhilippinesPolandPortugalRomaniaRussiaSaudi ArabiaScotlandSenegalSerbiaSierra LeoneSingaporeSomaliaSouth AfricaSouth AmericaSouth Central AsiaSouth Eastern AsiaSouthern EuropeSpainSri LankaSt. Vincent and the GrenadinesSudanSwedenSwitzerlandSyriaTaiwanThailandTrinidad and TobagoTurkeyUgandaUkraineUruguayUzbekistanVenezuelaVietnamWest IndiesWestern AfricaWestern AsiaWestern EuropeYemenZaireZimbabweAzores
Hearing Disability
Income
Poverty
Unemployment
Labor Participation
Family Structure
Vehicle Availability
Education Level
Disability

Hearing Disability Comparison

Immigrants from Brazil

Soviet Union

Excellent
Excellent
2.9%
HEARING DISABILITY
84.6/ 100
METRIC RATING
136th/ 347
METRIC RANK
2.9%
HEARING DISABILITY
84.8/ 100
METRIC RATING
135th/ 347
METRIC RANK

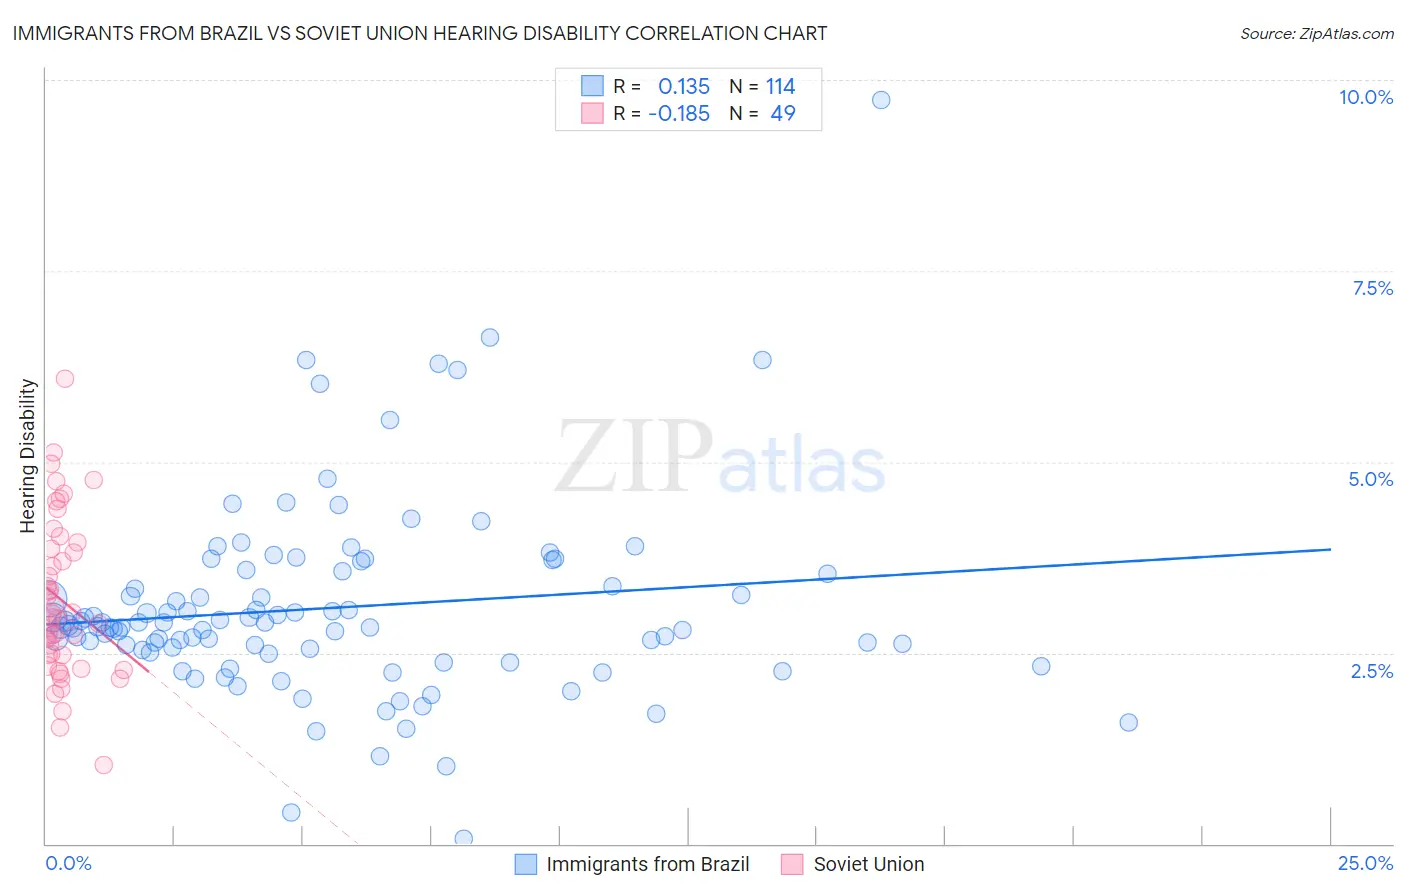
Immigrants from Brazil vs Soviet Union Hearing Disability Correlation Chart

The statistical analysis conducted on geographies consisting of 342,924,003 people shows a poor positive correlation between the proportion of Immigrants from Brazil and percentage of population with hearing disability in the United States with a correlation coefficient (R) of 0.135 and weighted average of 2.9%. Similarly, the statistical analysis conducted on geographies consisting of 43,504,651 people shows a poor negative correlation between the proportion of Soviet Union and percentage of population with hearing disability in the United States with a correlation coefficient (R) of -0.185 and weighted average of 2.9%, a difference of 0.030%.
Immigrants from Brazil vs Soviet Union Hearing Disability

Hearing Disability Correlation Summary

MeasurementImmigrants from BrazilSoviet Union
Minimum0.070%1.0%
Maximum9.7%6.1%
Range9.7%5.1%
Mean3.1%3.2%
Median2.9%3.0%
Interquartile 25% (IQ1)2.5%2.4%
Interquartile 75% (IQ3)3.5%3.9%
Interquartile Range (IQR)0.99%1.5%
Standard Deviation (Sample)1.3%1.0%
Standard Deviation (Population)1.3%1.0%

Demographics Similar to Immigrants from Brazil and Soviet Union by Hearing Disability

In terms of hearing disability, the demographic groups most similar to Immigrants from Brazil are Sri Lankan (2.9%, a difference of 0.10%), Immigrants from Costa Rica (2.9%, a difference of 0.10%), Bermudan (2.9%, a difference of 0.15%), Ugandan (2.9%, a difference of 0.17%), and Immigrants from Jordan (2.9%, a difference of 0.17%). Similarly, the demographic groups most similar to Soviet Union are Sri Lankan (2.9%, a difference of 0.13%), Immigrants from Costa Rica (2.9%, a difference of 0.13%), Ugandan (2.9%, a difference of 0.14%), Bermudan (2.9%, a difference of 0.18%), and Immigrants from Jordan (2.9%, a difference of 0.20%).
DemographicsRating | RankHearing Disability
Immigrants | Albania
88.5
/100
|
#125
Excellent
2.9%
Immigrants | Sudan
87.8
/100
|
#126
Excellent
2.9%
South American Indians
86.9
/100
|
#127
Excellent
2.9%
Immigrants | Western Asia
86.9
/100
|
#128
Excellent
2.9%
Immigrants | Uganda
86.6
/100
|
#129
Excellent
2.9%
Immigrants | Vietnam
86.5
/100
|
#130
Excellent
2.9%
Immigrants | Kenya
86.1
/100
|
#131
Excellent
2.9%
Chileans
85.8
/100
|
#132
Excellent
2.9%
Immigrants | Syria
85.8
/100
|
#133
Excellent
2.9%
Ugandans
85.5
/100
|
#134
Excellent
2.9%
Soviet Union
84.8
/100
|
#135
Excellent
2.9%
Immigrants | Brazil
84.6
/100
|
#136
Excellent
2.9%
Sri Lankans
84.1
/100
|
#137
Excellent
2.9%
Immigrants | Costa Rica
84.0
/100
|
#138
Excellent
2.9%
Bermudans
83.8
/100
|
#139
Excellent
2.9%
Immigrants | Jordan
83.7
/100
|
#140
Excellent
2.9%
Sub-Saharan Africans
83.3
/100
|
#141
Excellent
2.9%
Laotians
81.1
/100
|
#142
Excellent
2.9%
Immigrants | Bahamas
80.9
/100
|
#143
Excellent
2.9%
Immigrants | Bulgaria
79.2
/100
|
#144
Good
2.9%
Immigrants | Congo
78.9
/100
|
#145
Good
2.9%