Mexican vs Soviet Union Hearing Disability
COMPARE
Mexican
Soviet Union
Hearing Disability
Hearing Disability Comparison
Mexicans
Soviet Union
3.2%
HEARING DISABILITY
5.6/ 100
METRIC RATING
223rd/ 347
METRIC RANK
2.9%
HEARING DISABILITY
84.8/ 100
METRIC RATING
135th/ 347
METRIC RANK
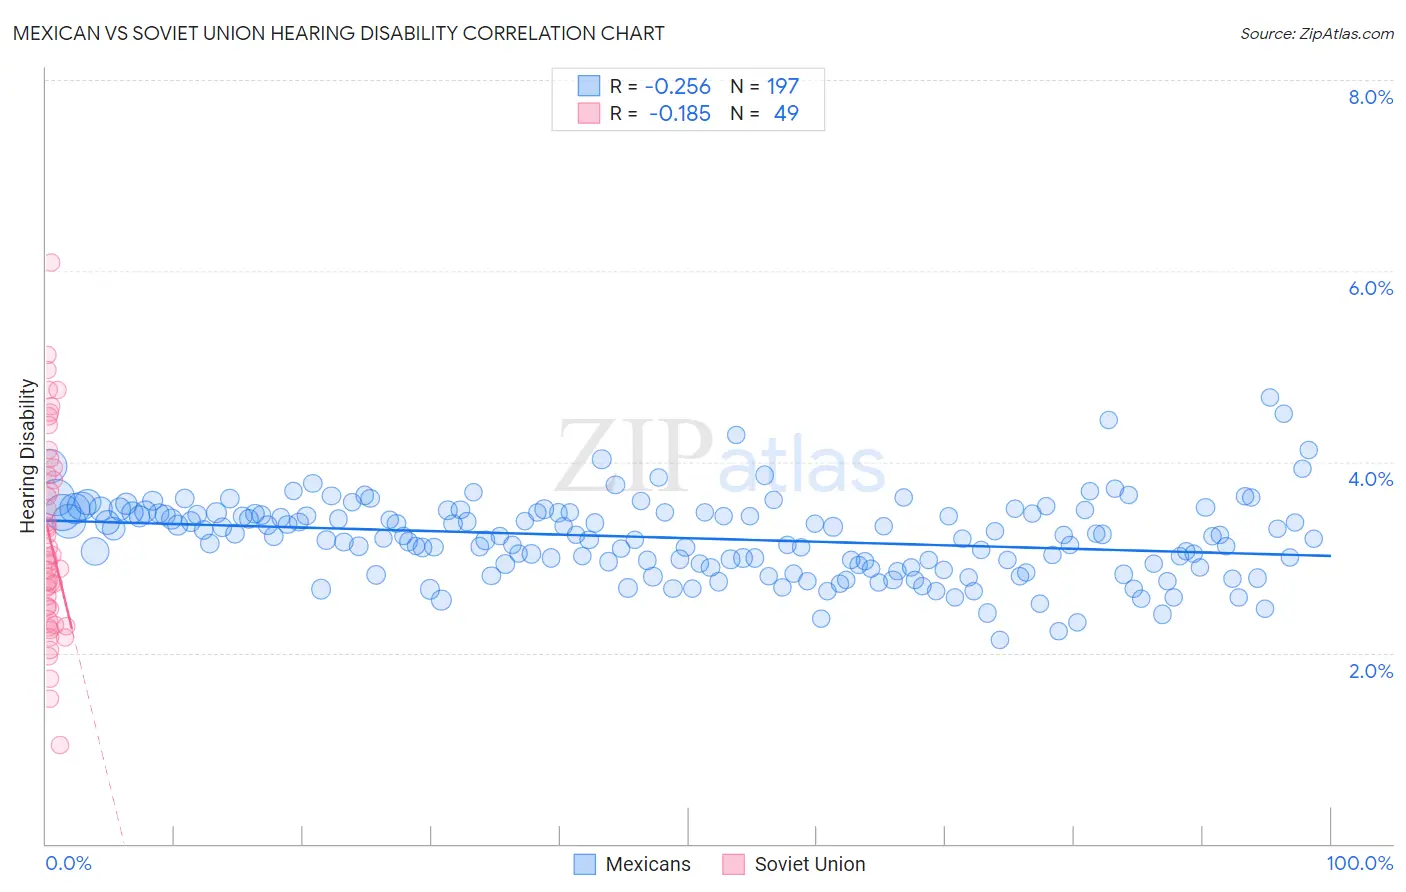
Mexican vs Soviet Union Hearing Disability Correlation Chart
The statistical analysis conducted on geographies consisting of 564,483,125 people shows a weak negative correlation between the proportion of Mexicans and percentage of population with hearing disability in the United States with a correlation coefficient (R) of -0.256 and weighted average of 3.2%. Similarly, the statistical analysis conducted on geographies consisting of 43,504,651 people shows a poor negative correlation between the proportion of Soviet Union and percentage of population with hearing disability in the United States with a correlation coefficient (R) of -0.185 and weighted average of 2.9%, a difference of 11.1%.
Hearing Disability Correlation Summary
| Measurement | Mexican | Soviet Union |
| Minimum | 2.1% | 1.0% |
| Maximum | 4.7% | 6.1% |
| Range | 2.5% | 5.1% |
| Mean | 3.2% | 3.2% |
| Median | 3.2% | 3.0% |
| Interquartile 25% (IQ1) | 2.9% | 2.4% |
| Interquartile 75% (IQ3) | 3.5% | 3.9% |
| Interquartile Range (IQR) | 0.56% | 1.5% |
| Standard Deviation (Sample) | 0.41% | 1.0% |
| Standard Deviation (Population) | 0.41% | 1.0% |
Similar Demographics by Hearing Disability
Demographics Similar to Mexicans by Hearing Disability
In terms of hearing disability, the demographic groups most similar to Mexicans are Icelander (3.2%, a difference of 0.17%), Latvian (3.2%, a difference of 0.21%), Lebanese (3.2%, a difference of 0.25%), Immigrants from Oceania (3.2%, a difference of 0.36%), and Immigrants from Laos (3.2%, a difference of 0.40%).
| Demographics | Rating | Rank | Hearing Disability |
| Immigrants | Norway | 7.3 /100 | #216 | Tragic 3.2% |
| Russians | 7.1 /100 | #217 | Tragic 3.2% |
| Immigrants | Northern Europe | 7.0 /100 | #218 | Tragic 3.2% |
| New Zealanders | 6.8 /100 | #219 | Tragic 3.2% |
| Malaysians | 6.6 /100 | #220 | Tragic 3.2% |
| Immigrants | Laos | 6.6 /100 | #221 | Tragic 3.2% |
| Immigrants | Oceania | 6.5 /100 | #222 | Tragic 3.2% |
| Mexicans | 5.6 /100 | #223 | Tragic 3.2% |
| Icelanders | 5.2 /100 | #224 | Tragic 3.2% |
| Latvians | 5.1 /100 | #225 | Tragic 3.2% |
| Lebanese | 5.0 /100 | #226 | Tragic 3.2% |
| Bhutanese | 4.6 /100 | #227 | Tragic 3.2% |
| Immigrants | Portugal | 4.3 /100 | #228 | Tragic 3.2% |
| Maltese | 4.1 /100 | #229 | Tragic 3.2% |
| Greeks | 3.2 /100 | #230 | Tragic 3.2% |
Demographics Similar to Soviet Union by Hearing Disability
In terms of hearing disability, the demographic groups most similar to Soviet Union are Immigrants from Brazil (2.9%, a difference of 0.030%), Sri Lankan (2.9%, a difference of 0.13%), Immigrants from Costa Rica (2.9%, a difference of 0.13%), Ugandan (2.9%, a difference of 0.14%), and Bermudan (2.9%, a difference of 0.18%).
| Demographics | Rating | Rank | Hearing Disability |
| Immigrants | Western Asia | 86.9 /100 | #128 | Excellent 2.9% |
| Immigrants | Uganda | 86.6 /100 | #129 | Excellent 2.9% |
| Immigrants | Vietnam | 86.5 /100 | #130 | Excellent 2.9% |
| Immigrants | Kenya | 86.1 /100 | #131 | Excellent 2.9% |
| Chileans | 85.8 /100 | #132 | Excellent 2.9% |
| Immigrants | Syria | 85.8 /100 | #133 | Excellent 2.9% |
| Ugandans | 85.5 /100 | #134 | Excellent 2.9% |
| Soviet Union | 84.8 /100 | #135 | Excellent 2.9% |
| Immigrants | Brazil | 84.6 /100 | #136 | Excellent 2.9% |
| Sri Lankans | 84.1 /100 | #137 | Excellent 2.9% |
| Immigrants | Costa Rica | 84.0 /100 | #138 | Excellent 2.9% |
| Bermudans | 83.8 /100 | #139 | Excellent 2.9% |
| Immigrants | Jordan | 83.7 /100 | #140 | Excellent 2.9% |
| Sub-Saharan Africans | 83.3 /100 | #141 | Excellent 2.9% |
| Laotians | 81.1 /100 | #142 | Excellent 2.9% |