Hmong vs Soviet Union Hearing Disability
COMPARE
Hmong
Soviet Union
Hearing Disability
Hearing Disability Comparison
Hmong
Soviet Union
3.4%
HEARING DISABILITY
0.2/ 100
METRIC RATING
256th/ 347
METRIC RANK
2.9%
HEARING DISABILITY
84.8/ 100
METRIC RATING
135th/ 347
METRIC RANK
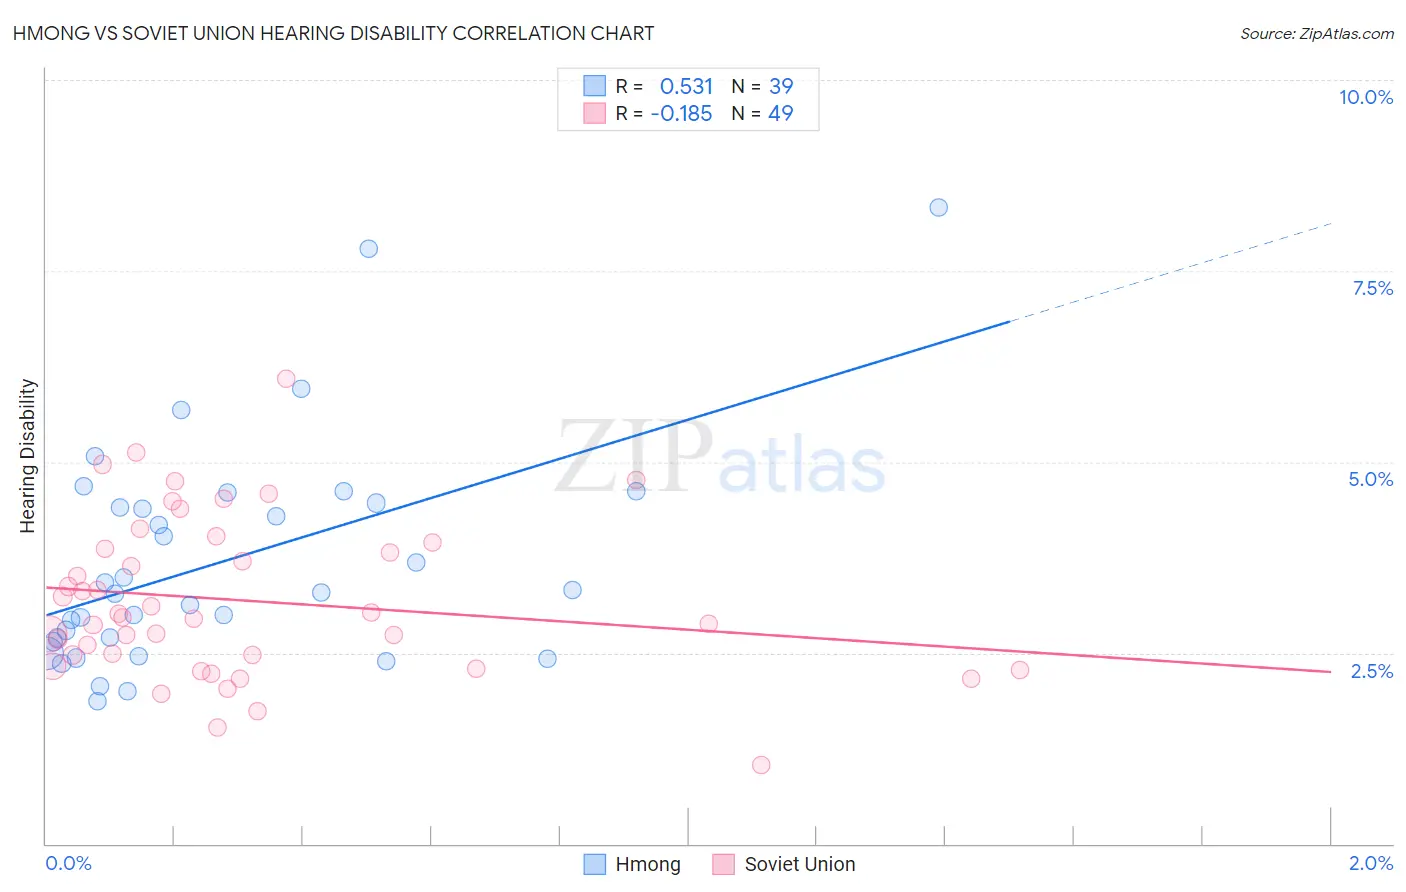
Hmong vs Soviet Union Hearing Disability Correlation Chart
The statistical analysis conducted on geographies consisting of 24,680,511 people shows a substantial positive correlation between the proportion of Hmong and percentage of population with hearing disability in the United States with a correlation coefficient (R) of 0.531 and weighted average of 3.4%. Similarly, the statistical analysis conducted on geographies consisting of 43,504,651 people shows a poor negative correlation between the proportion of Soviet Union and percentage of population with hearing disability in the United States with a correlation coefficient (R) of -0.185 and weighted average of 2.9%, a difference of 19.4%.
Hearing Disability Correlation Summary
| Measurement | Hmong | Soviet Union |
| Minimum | 1.9% | 1.0% |
| Maximum | 8.3% | 6.1% |
| Range | 6.5% | 5.1% |
| Mean | 3.7% | 3.2% |
| Median | 3.3% | 3.0% |
| Interquartile 25% (IQ1) | 2.6% | 2.4% |
| Interquartile 75% (IQ3) | 4.5% | 3.9% |
| Interquartile Range (IQR) | 1.8% | 1.5% |
| Standard Deviation (Sample) | 1.5% | 1.0% |
| Standard Deviation (Population) | 1.4% | 1.0% |
Similar Demographics by Hearing Disability
Demographics Similar to Hmong by Hearing Disability
In terms of hearing disability, the demographic groups most similar to Hmong are Polish (3.4%, a difference of 0.040%), Slavic (3.4%, a difference of 0.27%), Yaqui (3.4%, a difference of 0.45%), Northern European (3.4%, a difference of 0.52%), and Carpatho Rusyn (3.4%, a difference of 0.70%).
| Demographics | Rating | Rank | Hearing Disability |
| Italians | 0.4 /100 | #249 | Tragic 3.4% |
| Yuman | 0.4 /100 | #250 | Tragic 3.4% |
| Hungarians | 0.4 /100 | #251 | Tragic 3.4% |
| Croatians | 0.4 /100 | #252 | Tragic 3.4% |
| Carpatho Rusyns | 0.3 /100 | #253 | Tragic 3.4% |
| Slavs | 0.2 /100 | #254 | Tragic 3.4% |
| Poles | 0.2 /100 | #255 | Tragic 3.4% |
| Hmong | 0.2 /100 | #256 | Tragic 3.4% |
| Yaqui | 0.2 /100 | #257 | Tragic 3.4% |
| Northern Europeans | 0.2 /100 | #258 | Tragic 3.4% |
| Slovenes | 0.1 /100 | #259 | Tragic 3.5% |
| Portuguese | 0.1 /100 | #260 | Tragic 3.5% |
| Hawaiians | 0.1 /100 | #261 | Tragic 3.5% |
| Immigrants | North America | 0.1 /100 | #262 | Tragic 3.5% |
| Immigrants | Canada | 0.1 /100 | #263 | Tragic 3.5% |
Demographics Similar to Soviet Union by Hearing Disability
In terms of hearing disability, the demographic groups most similar to Soviet Union are Immigrants from Brazil (2.9%, a difference of 0.030%), Sri Lankan (2.9%, a difference of 0.13%), Immigrants from Costa Rica (2.9%, a difference of 0.13%), Ugandan (2.9%, a difference of 0.14%), and Bermudan (2.9%, a difference of 0.18%).
| Demographics | Rating | Rank | Hearing Disability |
| Immigrants | Western Asia | 86.9 /100 | #128 | Excellent 2.9% |
| Immigrants | Uganda | 86.6 /100 | #129 | Excellent 2.9% |
| Immigrants | Vietnam | 86.5 /100 | #130 | Excellent 2.9% |
| Immigrants | Kenya | 86.1 /100 | #131 | Excellent 2.9% |
| Chileans | 85.8 /100 | #132 | Excellent 2.9% |
| Immigrants | Syria | 85.8 /100 | #133 | Excellent 2.9% |
| Ugandans | 85.5 /100 | #134 | Excellent 2.9% |
| Soviet Union | 84.8 /100 | #135 | Excellent 2.9% |
| Immigrants | Brazil | 84.6 /100 | #136 | Excellent 2.9% |
| Sri Lankans | 84.1 /100 | #137 | Excellent 2.9% |
| Immigrants | Costa Rica | 84.0 /100 | #138 | Excellent 2.9% |
| Bermudans | 83.8 /100 | #139 | Excellent 2.9% |
| Immigrants | Jordan | 83.7 /100 | #140 | Excellent 2.9% |
| Sub-Saharan Africans | 83.3 /100 | #141 | Excellent 2.9% |
| Laotians | 81.1 /100 | #142 | Excellent 2.9% |