Immigrants from Brazil vs Romanian Hearing Disability
COMPARE
Immigrants from Brazil
Romanian
Hearing Disability
Hearing Disability Comparison
Immigrants from Brazil
Romanians
2.9%
HEARING DISABILITY
84.6/ 100
METRIC RATING
136th/ 347
METRIC RANK
3.1%
HEARING DISABILITY
12.1/ 100
METRIC RATING
211th/ 347
METRIC RANK
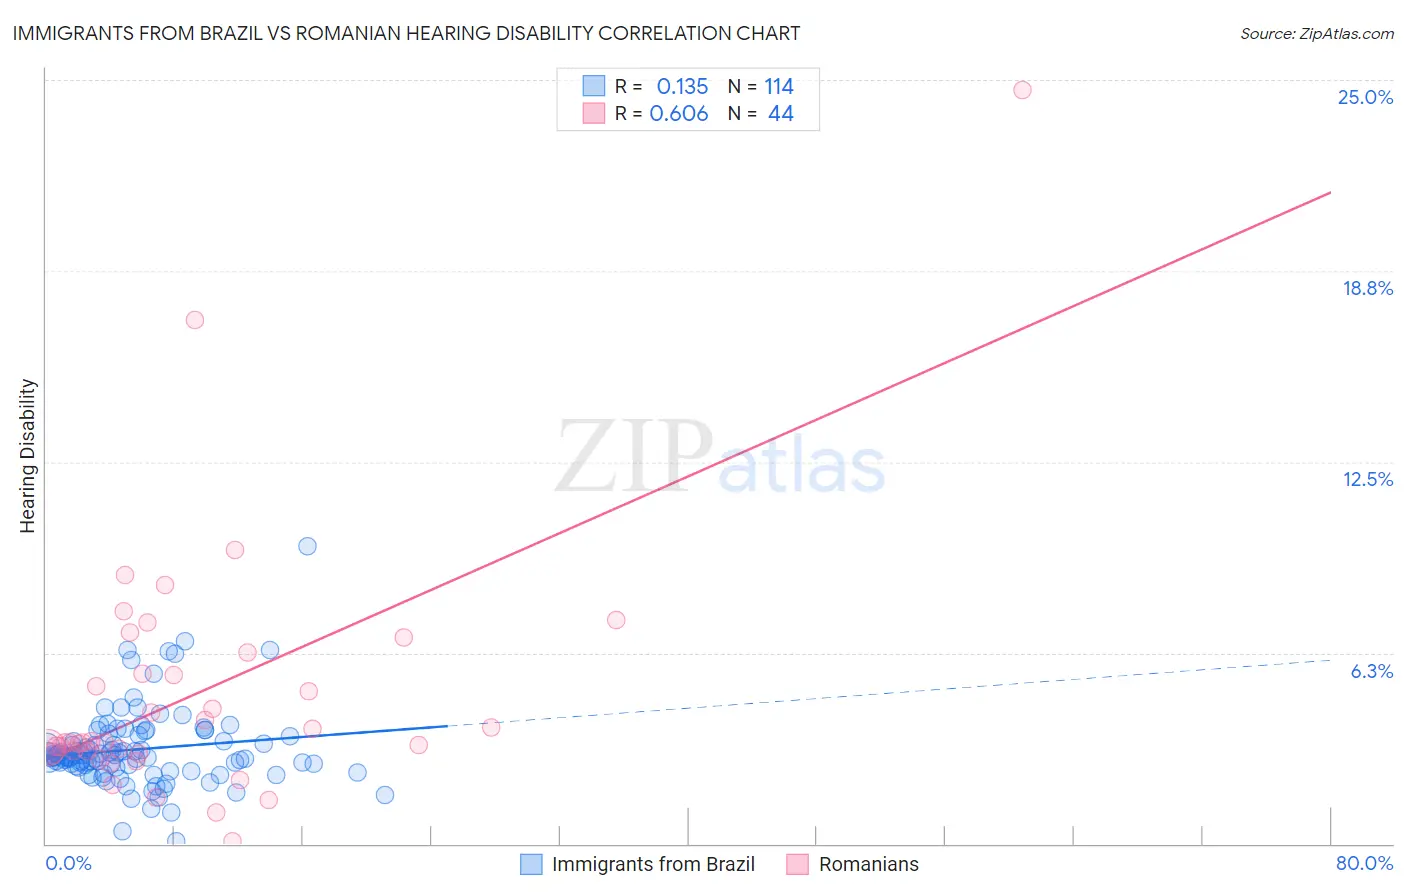
Immigrants from Brazil vs Romanian Hearing Disability Correlation Chart
The statistical analysis conducted on geographies consisting of 342,924,003 people shows a poor positive correlation between the proportion of Immigrants from Brazil and percentage of population with hearing disability in the United States with a correlation coefficient (R) of 0.135 and weighted average of 2.9%. Similarly, the statistical analysis conducted on geographies consisting of 377,801,954 people shows a significant positive correlation between the proportion of Romanians and percentage of population with hearing disability in the United States with a correlation coefficient (R) of 0.606 and weighted average of 3.1%, a difference of 9.0%.
Hearing Disability Correlation Summary
| Measurement | Immigrants from Brazil | Romanian |
| Minimum | 0.070% | 0.091% |
| Maximum | 9.7% | 24.7% |
| Range | 9.7% | 24.6% |
| Mean | 3.1% | 4.9% |
| Median | 2.9% | 3.3% |
| Interquartile 25% (IQ1) | 2.5% | 3.0% |
| Interquartile 75% (IQ3) | 3.5% | 5.9% |
| Interquartile Range (IQR) | 0.99% | 2.9% |
| Standard Deviation (Sample) | 1.3% | 4.2% |
| Standard Deviation (Population) | 1.3% | 4.2% |
Similar Demographics by Hearing Disability
Demographics Similar to Immigrants from Brazil by Hearing Disability
In terms of hearing disability, the demographic groups most similar to Immigrants from Brazil are Soviet Union (2.9%, a difference of 0.030%), Sri Lankan (2.9%, a difference of 0.10%), Immigrants from Costa Rica (2.9%, a difference of 0.10%), Bermudan (2.9%, a difference of 0.15%), and Ugandan (2.9%, a difference of 0.17%).
| Demographics | Rating | Rank | Hearing Disability |
| Immigrants | Uganda | 86.6 /100 | #129 | Excellent 2.9% |
| Immigrants | Vietnam | 86.5 /100 | #130 | Excellent 2.9% |
| Immigrants | Kenya | 86.1 /100 | #131 | Excellent 2.9% |
| Chileans | 85.8 /100 | #132 | Excellent 2.9% |
| Immigrants | Syria | 85.8 /100 | #133 | Excellent 2.9% |
| Ugandans | 85.5 /100 | #134 | Excellent 2.9% |
| Soviet Union | 84.8 /100 | #135 | Excellent 2.9% |
| Immigrants | Brazil | 84.6 /100 | #136 | Excellent 2.9% |
| Sri Lankans | 84.1 /100 | #137 | Excellent 2.9% |
| Immigrants | Costa Rica | 84.0 /100 | #138 | Excellent 2.9% |
| Bermudans | 83.8 /100 | #139 | Excellent 2.9% |
| Immigrants | Jordan | 83.7 /100 | #140 | Excellent 2.9% |
| Sub-Saharan Africans | 83.3 /100 | #141 | Excellent 2.9% |
| Laotians | 81.1 /100 | #142 | Excellent 2.9% |
| Immigrants | Bahamas | 80.9 /100 | #143 | Excellent 2.9% |
Demographics Similar to Romanians by Hearing Disability
In terms of hearing disability, the demographic groups most similar to Romanians are Cape Verdean (3.1%, a difference of 0.040%), Immigrants from Hungary (3.1%, a difference of 0.080%), Immigrants from Latvia (3.1%, a difference of 0.13%), Pakistani (3.1%, a difference of 0.21%), and Immigrants from Iraq (3.1%, a difference of 0.36%).
| Demographics | Rating | Rank | Hearing Disability |
| Immigrants | Czechoslovakia | 15.9 /100 | #204 | Poor 3.1% |
| Alsatians | 15.9 /100 | #205 | Poor 3.1% |
| Eastern Europeans | 15.5 /100 | #206 | Poor 3.1% |
| Hispanics or Latinos | 15.1 /100 | #207 | Poor 3.1% |
| Immigrants | Latvia | 12.7 /100 | #208 | Poor 3.1% |
| Immigrants | Hungary | 12.5 /100 | #209 | Poor 3.1% |
| Cape Verdeans | 12.2 /100 | #210 | Poor 3.1% |
| Romanians | 12.1 /100 | #211 | Poor 3.1% |
| Pakistanis | 11.1 /100 | #212 | Poor 3.1% |
| Immigrants | Iraq | 10.5 /100 | #213 | Poor 3.1% |
| Australians | 8.1 /100 | #214 | Tragic 3.2% |
| Bangladeshis | 8.1 /100 | #215 | Tragic 3.2% |
| Immigrants | Norway | 7.3 /100 | #216 | Tragic 3.2% |
| Russians | 7.1 /100 | #217 | Tragic 3.2% |
| Immigrants | Northern Europe | 7.0 /100 | #218 | Tragic 3.2% |