Immigrants from Brazil vs Arab Hearing Disability
COMPARE
Immigrants from Brazil
Arab
Hearing Disability
Hearing Disability Comparison
Immigrants from Brazil
Arabs
2.9%
HEARING DISABILITY
84.6/ 100
METRIC RATING
136th/ 347
METRIC RANK
3.0%
HEARING DISABILITY
57.6/ 100
METRIC RATING
169th/ 347
METRIC RANK
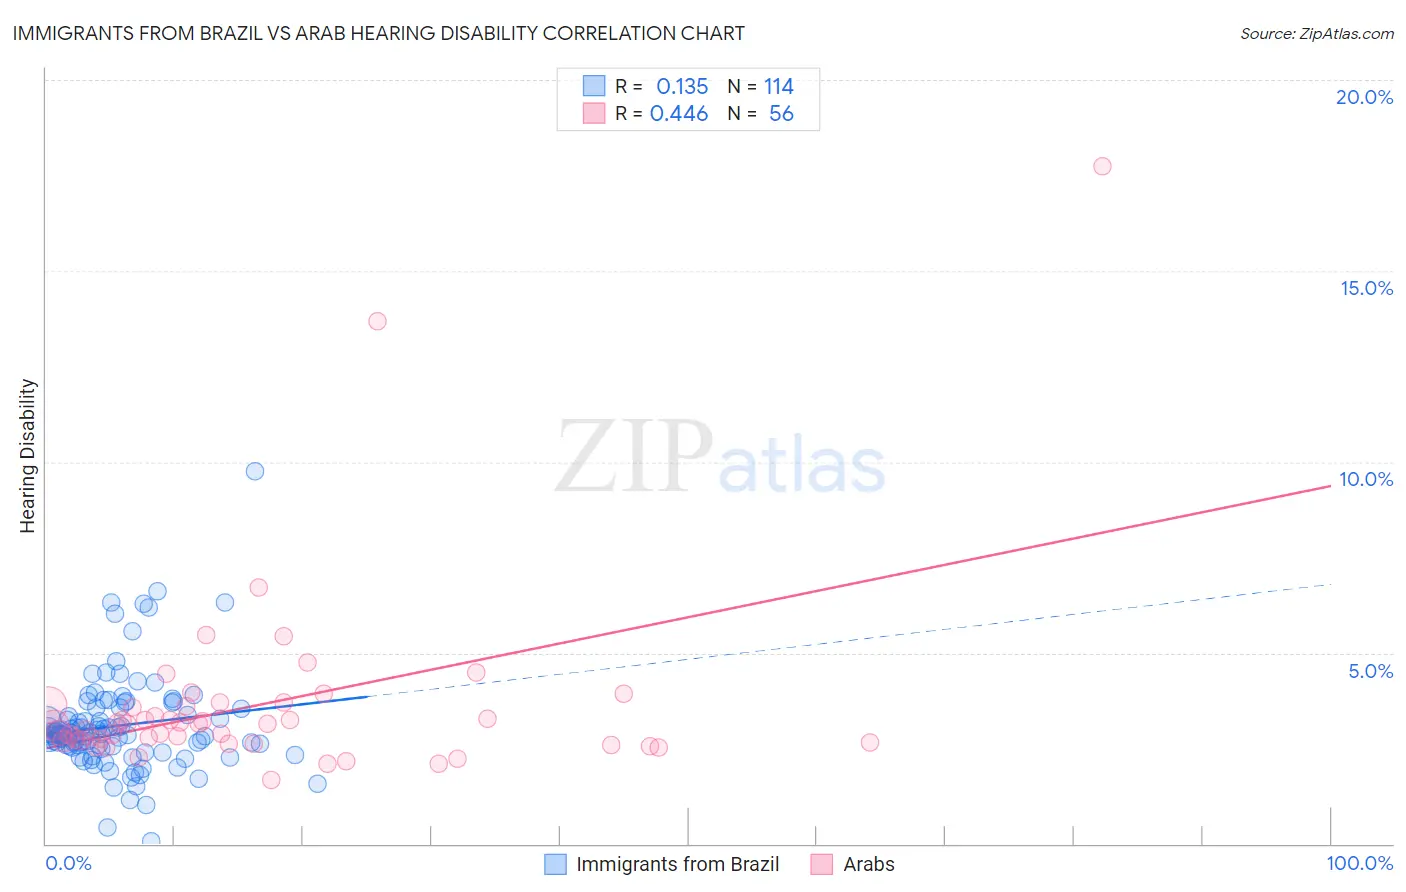
Immigrants from Brazil vs Arab Hearing Disability Correlation Chart
The statistical analysis conducted on geographies consisting of 342,924,003 people shows a poor positive correlation between the proportion of Immigrants from Brazil and percentage of population with hearing disability in the United States with a correlation coefficient (R) of 0.135 and weighted average of 2.9%. Similarly, the statistical analysis conducted on geographies consisting of 486,579,834 people shows a moderate positive correlation between the proportion of Arabs and percentage of population with hearing disability in the United States with a correlation coefficient (R) of 0.446 and weighted average of 3.0%, a difference of 3.4%.
Hearing Disability Correlation Summary
| Measurement | Immigrants from Brazil | Arab |
| Minimum | 0.070% | 1.7% |
| Maximum | 9.7% | 17.8% |
| Range | 9.7% | 16.1% |
| Mean | 3.1% | 3.6% |
| Median | 2.9% | 3.1% |
| Interquartile 25% (IQ1) | 2.5% | 2.7% |
| Interquartile 75% (IQ3) | 3.5% | 3.6% |
| Interquartile Range (IQR) | 0.99% | 0.96% |
| Standard Deviation (Sample) | 1.3% | 2.5% |
| Standard Deviation (Population) | 1.3% | 2.5% |
Similar Demographics by Hearing Disability
Demographics Similar to Immigrants from Brazil by Hearing Disability
In terms of hearing disability, the demographic groups most similar to Immigrants from Brazil are Soviet Union (2.9%, a difference of 0.030%), Sri Lankan (2.9%, a difference of 0.10%), Immigrants from Costa Rica (2.9%, a difference of 0.10%), Bermudan (2.9%, a difference of 0.15%), and Ugandan (2.9%, a difference of 0.17%).
| Demographics | Rating | Rank | Hearing Disability |
| Immigrants | Uganda | 86.6 /100 | #129 | Excellent 2.9% |
| Immigrants | Vietnam | 86.5 /100 | #130 | Excellent 2.9% |
| Immigrants | Kenya | 86.1 /100 | #131 | Excellent 2.9% |
| Chileans | 85.8 /100 | #132 | Excellent 2.9% |
| Immigrants | Syria | 85.8 /100 | #133 | Excellent 2.9% |
| Ugandans | 85.5 /100 | #134 | Excellent 2.9% |
| Soviet Union | 84.8 /100 | #135 | Excellent 2.9% |
| Immigrants | Brazil | 84.6 /100 | #136 | Excellent 2.9% |
| Sri Lankans | 84.1 /100 | #137 | Excellent 2.9% |
| Immigrants | Costa Rica | 84.0 /100 | #138 | Excellent 2.9% |
| Bermudans | 83.8 /100 | #139 | Excellent 2.9% |
| Immigrants | Jordan | 83.7 /100 | #140 | Excellent 2.9% |
| Sub-Saharan Africans | 83.3 /100 | #141 | Excellent 2.9% |
| Laotians | 81.1 /100 | #142 | Excellent 2.9% |
| Immigrants | Bahamas | 80.9 /100 | #143 | Excellent 2.9% |
Demographics Similar to Arabs by Hearing Disability
In terms of hearing disability, the demographic groups most similar to Arabs are Immigrants from Greece (3.0%, a difference of 0.030%), Immigrants from Eastern Europe (3.0%, a difference of 0.040%), Immigrants from Cabo Verde (3.0%, a difference of 0.070%), Immigrants from Ukraine (3.0%, a difference of 0.10%), and Armenian (3.0%, a difference of 0.15%).
| Demographics | Rating | Rank | Hearing Disability |
| Immigrants | Japan | 66.3 /100 | #162 | Good 2.9% |
| Immigrants | Central America | 64.9 /100 | #163 | Good 3.0% |
| Immigrants | Cambodia | 64.8 /100 | #164 | Good 3.0% |
| Immigrants | Zimbabwe | 64.2 /100 | #165 | Good 3.0% |
| Immigrants | South Eastern Asia | 62.9 /100 | #166 | Good 3.0% |
| Immigrants | Eastern Europe | 58.1 /100 | #167 | Average 3.0% |
| Immigrants | Greece | 57.9 /100 | #168 | Average 3.0% |
| Arabs | 57.6 /100 | #169 | Average 3.0% |
| Immigrants | Cabo Verde | 56.9 /100 | #170 | Average 3.0% |
| Immigrants | Ukraine | 56.6 /100 | #171 | Average 3.0% |
| Armenians | 56.0 /100 | #172 | Average 3.0% |
| Immigrants | Serbia | 51.1 /100 | #173 | Average 3.0% |
| Indonesians | 50.0 /100 | #174 | Average 3.0% |
| Immigrants | Romania | 48.4 /100 | #175 | Average 3.0% |
| Panamanians | 47.0 /100 | #176 | Average 3.0% |