Immigrants from Barbados vs Trinidadian and Tobagonian Seniors Poverty Over the Age of 65
COMPARE
Immigrants from Barbados
Trinidadian and Tobagonian
Seniors Poverty Over the Age of 65
Seniors Poverty Over the Age of 65 Comparison
Immigrants from Barbados
Trinidadians and Tobagonians
14.8%
SENIORS POVERTY OVER THE AGE OF 65
0.0/ 100
METRIC RATING
322nd/ 347
METRIC RANK
14.2%
SENIORS POVERTY OVER THE AGE OF 65
0.0/ 100
METRIC RATING
308th/ 347
METRIC RANK
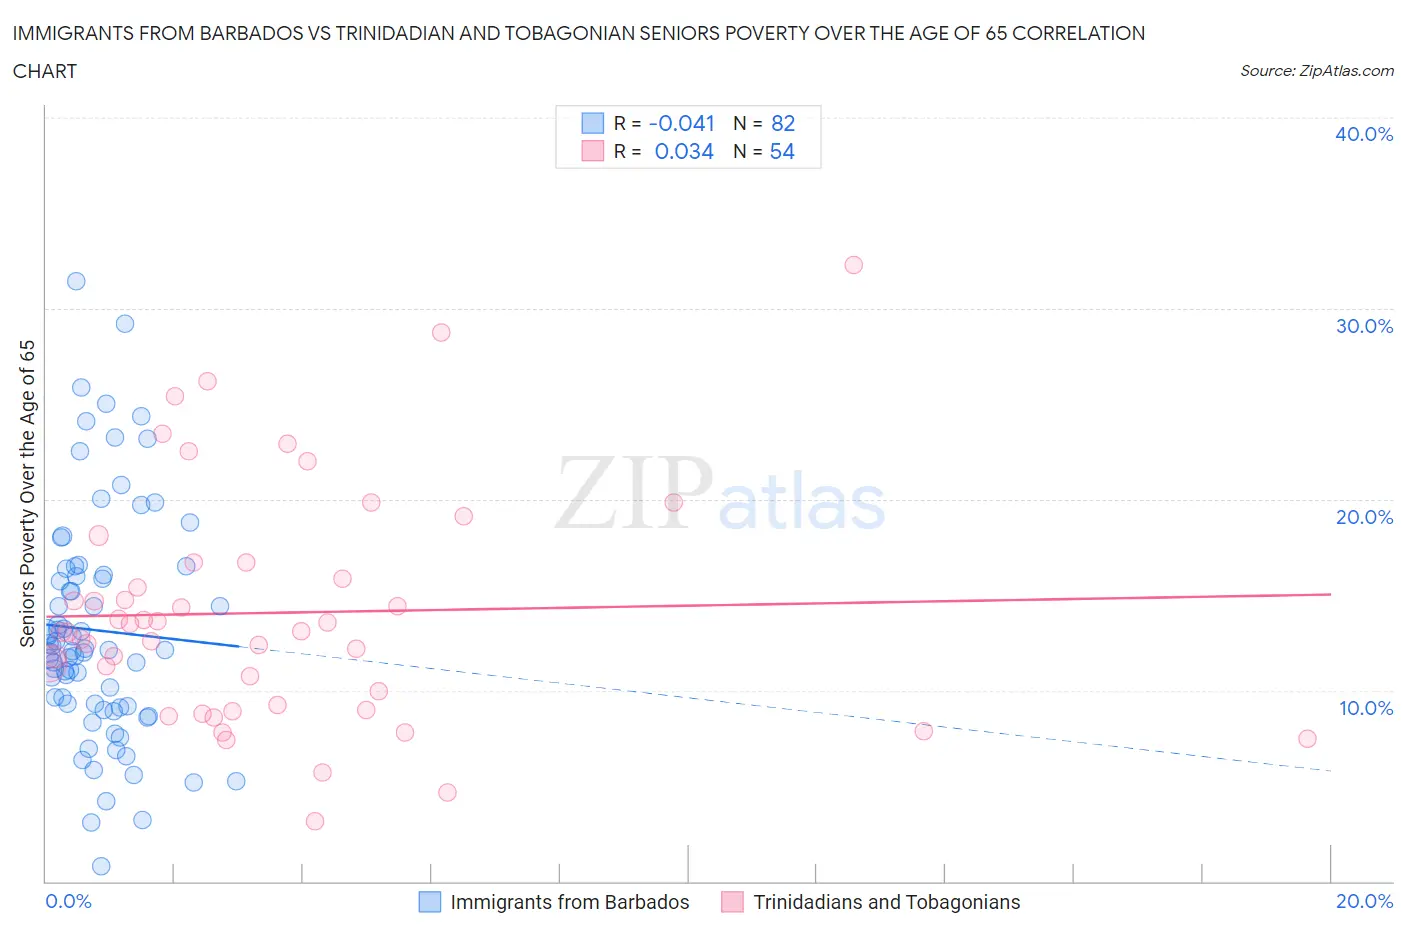
Immigrants from Barbados vs Trinidadian and Tobagonian Seniors Poverty Over the Age of 65 Correlation Chart
The statistical analysis conducted on geographies consisting of 112,748,411 people shows no correlation between the proportion of Immigrants from Barbados and poverty level among seniors over the age of 65 in the United States with a correlation coefficient (R) of -0.041 and weighted average of 14.8%. Similarly, the statistical analysis conducted on geographies consisting of 219,204,036 people shows no correlation between the proportion of Trinidadians and Tobagonians and poverty level among seniors over the age of 65 in the United States with a correlation coefficient (R) of 0.034 and weighted average of 14.2%, a difference of 4.2%.
Seniors Poverty Over the Age of 65 Correlation Summary
| Measurement | Immigrants from Barbados | Trinidadian and Tobagonian |
| Minimum | 0.81% | 3.1% |
| Maximum | 31.4% | 32.3% |
| Range | 30.6% | 29.1% |
| Mean | 13.1% | 14.1% |
| Median | 12.1% | 13.1% |
| Interquartile 25% (IQ1) | 9.1% | 9.2% |
| Interquartile 75% (IQ3) | 16.1% | 16.7% |
| Interquartile Range (IQR) | 6.9% | 7.4% |
| Standard Deviation (Sample) | 6.0% | 6.1% |
| Standard Deviation (Population) | 6.0% | 6.0% |
Demographics Similar to Immigrants from Barbados and Trinidadians and Tobagonians by Seniors Poverty Over the Age of 65
In terms of seniors poverty over the age of 65, the demographic groups most similar to Immigrants from Barbados are Yakama (14.8%, a difference of 0.15%), Houma (14.7%, a difference of 0.38%), Immigrants from Haiti (14.7%, a difference of 0.59%), Cape Verdean (14.7%, a difference of 0.78%), and Nicaraguan (15.0%, a difference of 1.5%). Similarly, the demographic groups most similar to Trinidadians and Tobagonians are Immigrants from West Indies (14.2%, a difference of 0.070%), Honduran (14.2%, a difference of 0.10%), Immigrants from Latin America (14.2%, a difference of 0.21%), Bahamian (14.2%, a difference of 0.36%), and Native/Alaskan (14.2%, a difference of 0.36%).
| Demographics | Rating | Rank | Seniors Poverty Over the Age of 65 |
| Immigrants | Trinidad and Tobago | 0.0 /100 | #305 | Tragic 14.1% |
| Immigrants | Latin America | 0.0 /100 | #306 | Tragic 14.2% |
| Immigrants | West Indies | 0.0 /100 | #307 | Tragic 14.2% |
| Trinidadians and Tobagonians | 0.0 /100 | #308 | Tragic 14.2% |
| Hondurans | 0.0 /100 | #309 | Tragic 14.2% |
| Bahamians | 0.0 /100 | #310 | Tragic 14.2% |
| Natives/Alaskans | 0.0 /100 | #311 | Tragic 14.2% |
| Hispanics or Latinos | 0.0 /100 | #312 | Tragic 14.3% |
| Barbadians | 0.0 /100 | #313 | Tragic 14.4% |
| Guyanese | 0.0 /100 | #314 | Tragic 14.4% |
| Immigrants | Ecuador | 0.0 /100 | #315 | Tragic 14.4% |
| Immigrants | Guyana | 0.0 /100 | #316 | Tragic 14.5% |
| Haitians | 0.0 /100 | #317 | Tragic 14.5% |
| Immigrants | Honduras | 0.0 /100 | #318 | Tragic 14.5% |
| Cape Verdeans | 0.0 /100 | #319 | Tragic 14.7% |
| Immigrants | Haiti | 0.0 /100 | #320 | Tragic 14.7% |
| Houma | 0.0 /100 | #321 | Tragic 14.7% |
| Immigrants | Barbados | 0.0 /100 | #322 | Tragic 14.8% |
| Yakama | 0.0 /100 | #323 | Tragic 14.8% |
| Nicaraguans | 0.0 /100 | #324 | Tragic 15.0% |
| Central American Indians | 0.0 /100 | #325 | Tragic 15.1% |