Immigrants from Austria vs American Disability Age 5 to 17
COMPARE
Immigrants from Austria
American
Disability Age 5 to 17
Disability Age 5 to 17 Comparison
Immigrants from Austria
Americans
5.3%
DISABILITY AGE 5 TO 17
98.9/ 100
METRIC RATING
98th/ 347
METRIC RANK
6.5%
DISABILITY AGE 5 TO 17
0.0/ 100
METRIC RATING
325th/ 347
METRIC RANK
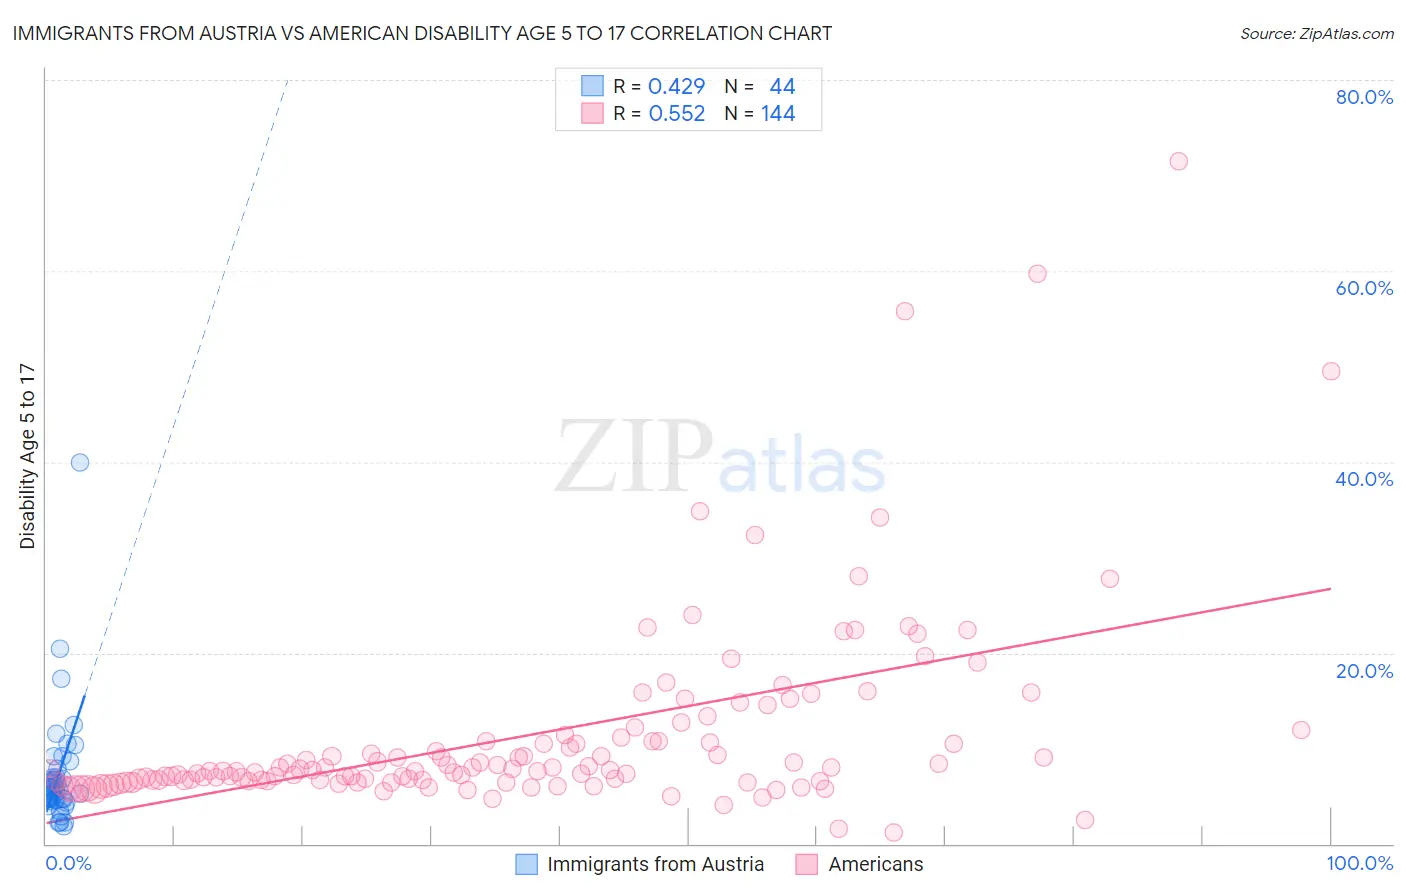
Immigrants from Austria vs American Disability Age 5 to 17 Correlation Chart
The statistical analysis conducted on geographies consisting of 166,993,239 people shows a moderate positive correlation between the proportion of Immigrants from Austria and percentage of population with a disability between the ages 5 and 17 in the United States with a correlation coefficient (R) of 0.429 and weighted average of 5.3%. Similarly, the statistical analysis conducted on geographies consisting of 566,133,165 people shows a substantial positive correlation between the proportion of Americans and percentage of population with a disability between the ages 5 and 17 in the United States with a correlation coefficient (R) of 0.552 and weighted average of 6.5%, a difference of 23.5%.
Disability Age 5 to 17 Correlation Summary
| Measurement | Immigrants from Austria | American |
| Minimum | 1.8% | 1.2% |
| Maximum | 40.0% | 71.4% |
| Range | 38.2% | 70.2% |
| Mean | 7.2% | 11.3% |
| Median | 5.7% | 7.7% |
| Interquartile 25% (IQ1) | 4.6% | 6.6% |
| Interquartile 75% (IQ3) | 7.4% | 10.8% |
| Interquartile Range (IQR) | 2.8% | 4.2% |
| Standard Deviation (Sample) | 6.2% | 10.2% |
| Standard Deviation (Population) | 6.2% | 10.2% |
Similar Demographics by Disability Age 5 to 17
Demographics Similar to Immigrants from Austria by Disability Age 5 to 17
In terms of disability age 5 to 17, the demographic groups most similar to Immigrants from Austria are Immigrants from El Salvador (5.3%, a difference of 0.050%), Immigrants from Europe (5.3%, a difference of 0.050%), Cambodian (5.3%, a difference of 0.090%), Immigrants from Grenada (5.3%, a difference of 0.21%), and Immigrants from Jordan (5.3%, a difference of 0.23%).
| Demographics | Rating | Rank | Disability Age 5 to 17 |
| Mongolians | 99.2 /100 | #91 | Exceptional 5.3% |
| Luxembourgers | 99.2 /100 | #92 | Exceptional 5.3% |
| Immigrants | Peru | 99.1 /100 | #93 | Exceptional 5.3% |
| Immigrants | Jordan | 99.1 /100 | #94 | Exceptional 5.3% |
| Immigrants | Grenada | 99.1 /100 | #95 | Exceptional 5.3% |
| Immigrants | El Salvador | 99.0 /100 | #96 | Exceptional 5.3% |
| Immigrants | Europe | 99.0 /100 | #97 | Exceptional 5.3% |
| Immigrants | Austria | 98.9 /100 | #98 | Exceptional 5.3% |
| Cambodians | 98.8 /100 | #99 | Exceptional 5.3% |
| Nepalese | 98.7 /100 | #100 | Exceptional 5.3% |
| Menominee | 98.7 /100 | #101 | Exceptional 5.3% |
| Nicaraguans | 98.6 /100 | #102 | Exceptional 5.3% |
| Salvadorans | 98.6 /100 | #103 | Exceptional 5.3% |
| Peruvians | 98.5 /100 | #104 | Exceptional 5.3% |
| Immigrants | Italy | 98.4 /100 | #105 | Exceptional 5.3% |
Demographics Similar to Americans by Disability Age 5 to 17
In terms of disability age 5 to 17, the demographic groups most similar to Americans are Dominican (6.5%, a difference of 0.050%), Potawatomi (6.5%, a difference of 0.13%), Osage (6.5%, a difference of 0.14%), Slovak (6.5%, a difference of 0.17%), and Tohono O'odham (6.5%, a difference of 0.19%).
| Demographics | Rating | Rank | Disability Age 5 to 17 |
| Comanche | 0.0 /100 | #318 | Tragic 6.4% |
| Delaware | 0.0 /100 | #319 | Tragic 6.5% |
| Africans | 0.0 /100 | #320 | Tragic 6.5% |
| Tohono O'odham | 0.0 /100 | #321 | Tragic 6.5% |
| Slovaks | 0.0 /100 | #322 | Tragic 6.5% |
| Osage | 0.0 /100 | #323 | Tragic 6.5% |
| Dominicans | 0.0 /100 | #324 | Tragic 6.5% |
| Americans | 0.0 /100 | #325 | Tragic 6.5% |
| Potawatomi | 0.0 /100 | #326 | Tragic 6.5% |
| French American Indians | 0.0 /100 | #327 | Tragic 6.6% |
| Pennsylvania Germans | 0.0 /100 | #328 | Tragic 6.6% |
| Blackfeet | 0.0 /100 | #329 | Tragic 6.6% |
| Dutch West Indians | 0.0 /100 | #330 | Tragic 6.7% |
| French Canadians | 0.0 /100 | #331 | Tragic 6.7% |
| Immigrants | Azores | 0.0 /100 | #332 | Tragic 6.7% |