Immigrants from Austria vs Immigrants from Guatemala Disability Age 5 to 17
COMPARE
Immigrants from Austria
Immigrants from Guatemala
Disability Age 5 to 17
Disability Age 5 to 17 Comparison
Immigrants from Austria
Immigrants from Guatemala
5.3%
DISABILITY AGE 5 TO 17
98.9/ 100
METRIC RATING
98th/ 347
METRIC RANK
5.5%
DISABILITY AGE 5 TO 17
86.6/ 100
METRIC RATING
145th/ 347
METRIC RANK
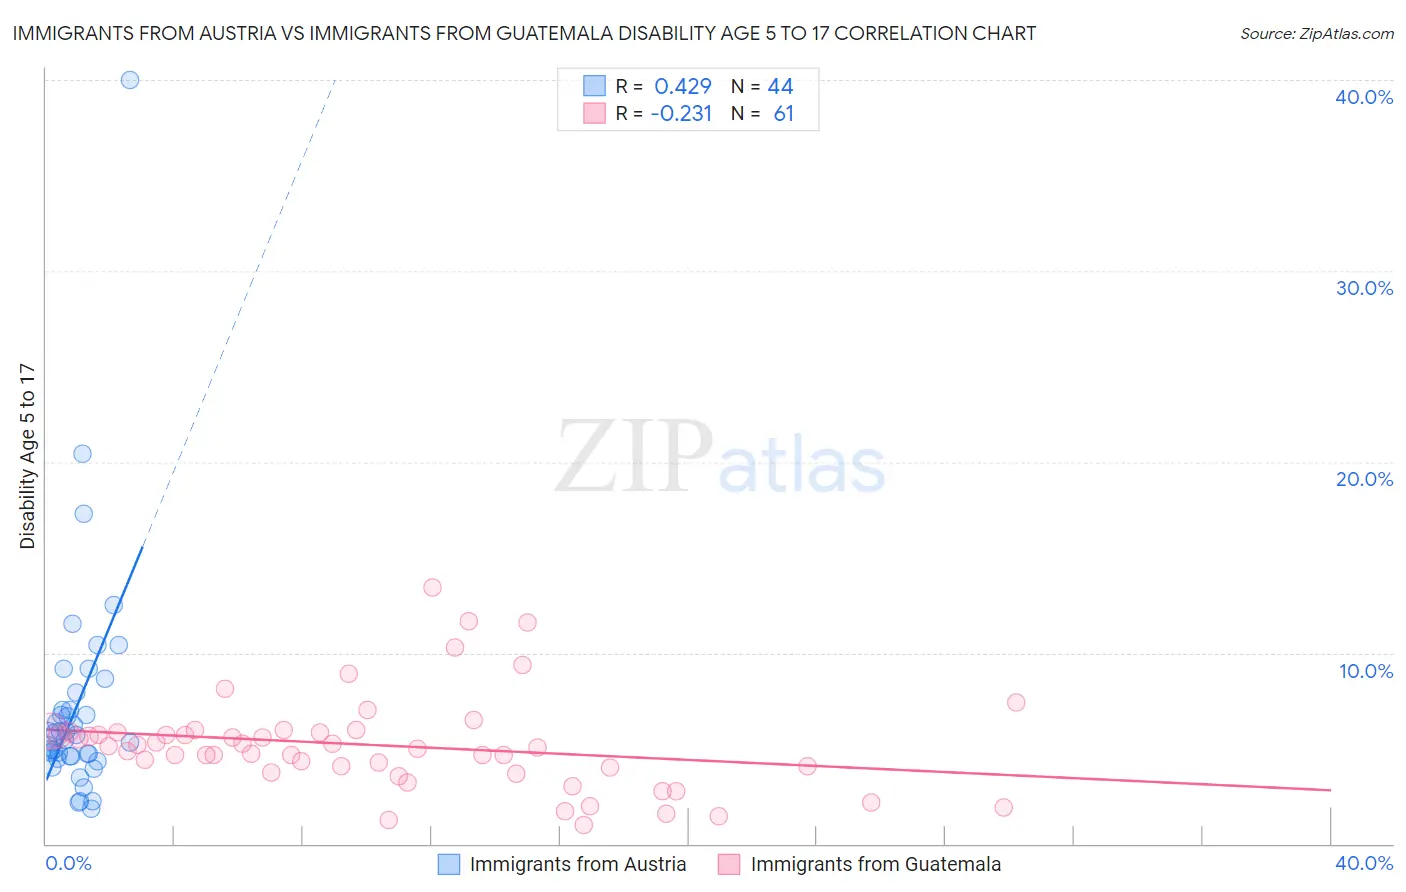
Immigrants from Austria vs Immigrants from Guatemala Disability Age 5 to 17 Correlation Chart
The statistical analysis conducted on geographies consisting of 166,993,239 people shows a moderate positive correlation between the proportion of Immigrants from Austria and percentage of population with a disability between the ages 5 and 17 in the United States with a correlation coefficient (R) of 0.429 and weighted average of 5.3%. Similarly, the statistical analysis conducted on geographies consisting of 375,293,918 people shows a weak negative correlation between the proportion of Immigrants from Guatemala and percentage of population with a disability between the ages 5 and 17 in the United States with a correlation coefficient (R) of -0.231 and weighted average of 5.5%, a difference of 3.5%.
Disability Age 5 to 17 Correlation Summary
| Measurement | Immigrants from Austria | Immigrants from Guatemala |
| Minimum | 1.8% | 0.98% |
| Maximum | 40.0% | 13.4% |
| Range | 38.2% | 12.4% |
| Mean | 7.2% | 5.2% |
| Median | 5.7% | 5.0% |
| Interquartile 25% (IQ1) | 4.6% | 3.9% |
| Interquartile 75% (IQ3) | 7.4% | 5.8% |
| Interquartile Range (IQR) | 2.8% | 2.0% |
| Standard Deviation (Sample) | 6.2% | 2.5% |
| Standard Deviation (Population) | 6.2% | 2.5% |
Similar Demographics by Disability Age 5 to 17
Demographics Similar to Immigrants from Austria by Disability Age 5 to 17
In terms of disability age 5 to 17, the demographic groups most similar to Immigrants from Austria are Immigrants from El Salvador (5.3%, a difference of 0.050%), Immigrants from Europe (5.3%, a difference of 0.050%), Cambodian (5.3%, a difference of 0.090%), Immigrants from Grenada (5.3%, a difference of 0.21%), and Immigrants from Jordan (5.3%, a difference of 0.23%).
| Demographics | Rating | Rank | Disability Age 5 to 17 |
| Mongolians | 99.2 /100 | #91 | Exceptional 5.3% |
| Luxembourgers | 99.2 /100 | #92 | Exceptional 5.3% |
| Immigrants | Peru | 99.1 /100 | #93 | Exceptional 5.3% |
| Immigrants | Jordan | 99.1 /100 | #94 | Exceptional 5.3% |
| Immigrants | Grenada | 99.1 /100 | #95 | Exceptional 5.3% |
| Immigrants | El Salvador | 99.0 /100 | #96 | Exceptional 5.3% |
| Immigrants | Europe | 99.0 /100 | #97 | Exceptional 5.3% |
| Immigrants | Austria | 98.9 /100 | #98 | Exceptional 5.3% |
| Cambodians | 98.8 /100 | #99 | Exceptional 5.3% |
| Nepalese | 98.7 /100 | #100 | Exceptional 5.3% |
| Menominee | 98.7 /100 | #101 | Exceptional 5.3% |
| Nicaraguans | 98.6 /100 | #102 | Exceptional 5.3% |
| Salvadorans | 98.6 /100 | #103 | Exceptional 5.3% |
| Peruvians | 98.5 /100 | #104 | Exceptional 5.3% |
| Immigrants | Italy | 98.4 /100 | #105 | Exceptional 5.3% |
Demographics Similar to Immigrants from Guatemala by Disability Age 5 to 17
In terms of disability age 5 to 17, the demographic groups most similar to Immigrants from Guatemala are Pakistani (5.5%, a difference of 0.080%), Immigrants from Hungary (5.5%, a difference of 0.14%), Colombian (5.5%, a difference of 0.16%), Albanian (5.5%, a difference of 0.29%), and South American Indian (5.5%, a difference of 0.32%).
| Demographics | Rating | Rank | Disability Age 5 to 17 |
| Immigrants | Oceania | 90.8 /100 | #138 | Exceptional 5.4% |
| Belizeans | 90.8 /100 | #139 | Exceptional 5.4% |
| Immigrants | Netherlands | 90.5 /100 | #140 | Exceptional 5.4% |
| South American Indians | 89.3 /100 | #141 | Excellent 5.5% |
| Colombians | 88.0 /100 | #142 | Excellent 5.5% |
| Immigrants | Hungary | 87.9 /100 | #143 | Excellent 5.5% |
| Pakistanis | 87.3 /100 | #144 | Excellent 5.5% |
| Immigrants | Guatemala | 86.6 /100 | #145 | Excellent 5.5% |
| Albanians | 83.7 /100 | #146 | Excellent 5.5% |
| Immigrants | Albania | 83.1 /100 | #147 | Excellent 5.5% |
| Samoans | 81.9 /100 | #148 | Excellent 5.5% |
| Central Americans | 81.6 /100 | #149 | Excellent 5.5% |
| Guatemalans | 81.5 /100 | #150 | Excellent 5.5% |
| Estonians | 80.8 /100 | #151 | Excellent 5.5% |
| Ute | 80.6 /100 | #152 | Excellent 5.5% |