Immigrants from Austria vs Immigrants from Barbados Disability Age 5 to 17
COMPARE
Immigrants from Austria
Immigrants from Barbados
Disability Age 5 to 17
Disability Age 5 to 17 Comparison
Immigrants from Austria
Immigrants from Barbados
5.3%
DISABILITY AGE 5 TO 17
98.9/ 100
METRIC RATING
98th/ 347
METRIC RANK
5.6%
DISABILITY AGE 5 TO 17
40.5/ 100
METRIC RATING
179th/ 347
METRIC RANK
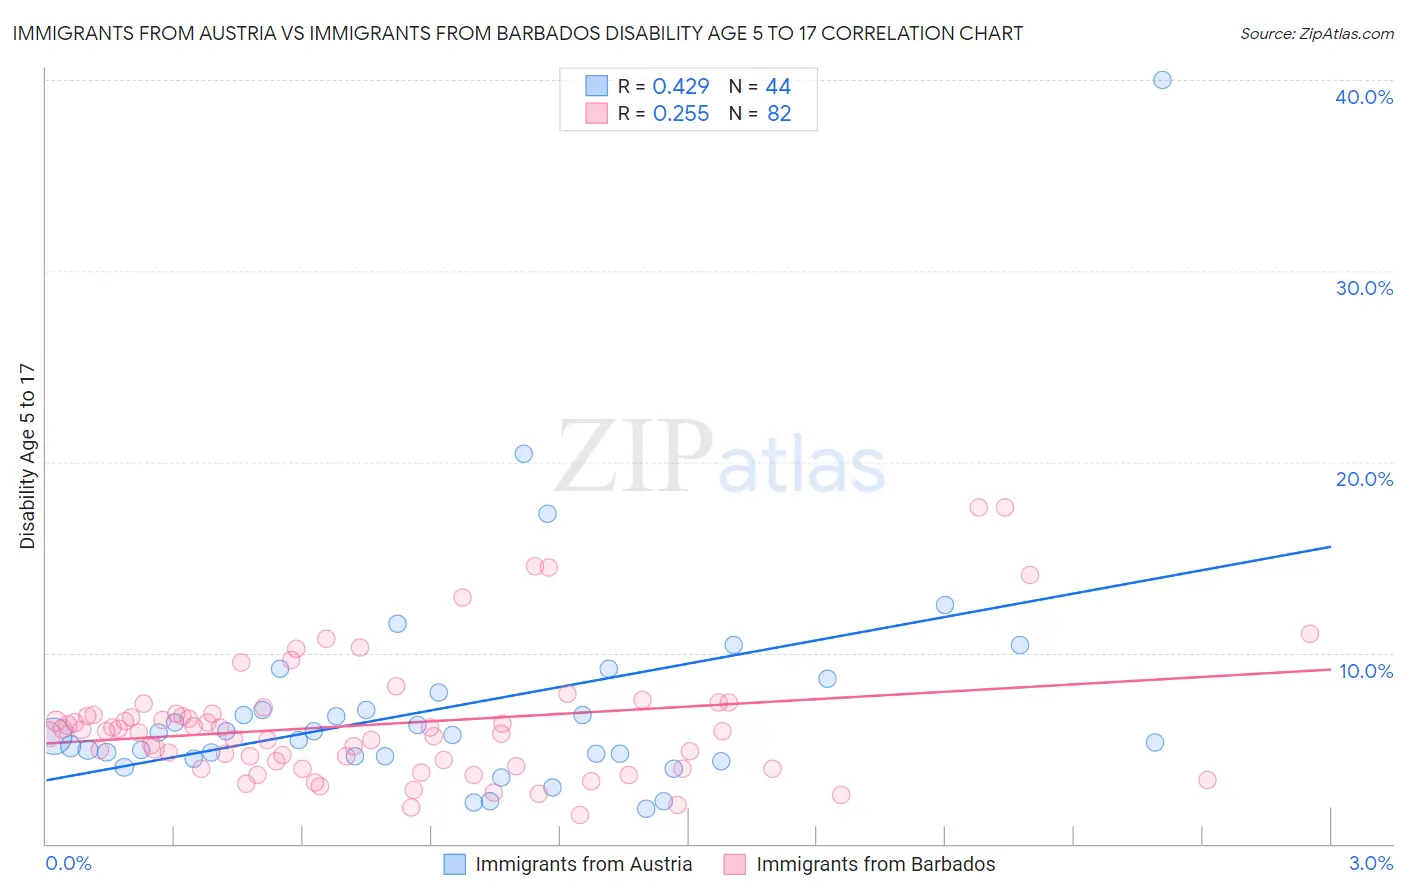
Immigrants from Austria vs Immigrants from Barbados Disability Age 5 to 17 Correlation Chart
The statistical analysis conducted on geographies consisting of 166,993,239 people shows a moderate positive correlation between the proportion of Immigrants from Austria and percentage of population with a disability between the ages 5 and 17 in the United States with a correlation coefficient (R) of 0.429 and weighted average of 5.3%. Similarly, the statistical analysis conducted on geographies consisting of 112,576,995 people shows a weak positive correlation between the proportion of Immigrants from Barbados and percentage of population with a disability between the ages 5 and 17 in the United States with a correlation coefficient (R) of 0.255 and weighted average of 5.6%, a difference of 6.4%.
Disability Age 5 to 17 Correlation Summary
| Measurement | Immigrants from Austria | Immigrants from Barbados |
| Minimum | 1.8% | 1.5% |
| Maximum | 40.0% | 17.6% |
| Range | 38.2% | 16.1% |
| Mean | 7.2% | 6.3% |
| Median | 5.7% | 5.9% |
| Interquartile 25% (IQ1) | 4.6% | 4.1% |
| Interquartile 75% (IQ3) | 7.4% | 6.8% |
| Interquartile Range (IQR) | 2.8% | 2.7% |
| Standard Deviation (Sample) | 6.2% | 3.2% |
| Standard Deviation (Population) | 6.2% | 3.2% |
Similar Demographics by Disability Age 5 to 17
Demographics Similar to Immigrants from Austria by Disability Age 5 to 17
In terms of disability age 5 to 17, the demographic groups most similar to Immigrants from Austria are Immigrants from El Salvador (5.3%, a difference of 0.050%), Immigrants from Europe (5.3%, a difference of 0.050%), Cambodian (5.3%, a difference of 0.090%), Immigrants from Grenada (5.3%, a difference of 0.21%), and Immigrants from Jordan (5.3%, a difference of 0.23%).
| Demographics | Rating | Rank | Disability Age 5 to 17 |
| Mongolians | 99.2 /100 | #91 | Exceptional 5.3% |
| Luxembourgers | 99.2 /100 | #92 | Exceptional 5.3% |
| Immigrants | Peru | 99.1 /100 | #93 | Exceptional 5.3% |
| Immigrants | Jordan | 99.1 /100 | #94 | Exceptional 5.3% |
| Immigrants | Grenada | 99.1 /100 | #95 | Exceptional 5.3% |
| Immigrants | El Salvador | 99.0 /100 | #96 | Exceptional 5.3% |
| Immigrants | Europe | 99.0 /100 | #97 | Exceptional 5.3% |
| Immigrants | Austria | 98.9 /100 | #98 | Exceptional 5.3% |
| Cambodians | 98.8 /100 | #99 | Exceptional 5.3% |
| Nepalese | 98.7 /100 | #100 | Exceptional 5.3% |
| Menominee | 98.7 /100 | #101 | Exceptional 5.3% |
| Nicaraguans | 98.6 /100 | #102 | Exceptional 5.3% |
| Salvadorans | 98.6 /100 | #103 | Exceptional 5.3% |
| Peruvians | 98.5 /100 | #104 | Exceptional 5.3% |
| Immigrants | Italy | 98.4 /100 | #105 | Exceptional 5.3% |
Demographics Similar to Immigrants from Barbados by Disability Age 5 to 17
In terms of disability age 5 to 17, the demographic groups most similar to Immigrants from Barbados are Immigrants from Uruguay (5.6%, a difference of 0.14%), Immigrants from England (5.6%, a difference of 0.21%), Mexican American Indian (5.6%, a difference of 0.27%), Immigrants from Latin America (5.6%, a difference of 0.32%), and Syrian (5.6%, a difference of 0.35%).
| Demographics | Rating | Rank | Disability Age 5 to 17 |
| Ukrainians | 51.5 /100 | #172 | Average 5.6% |
| Uruguayans | 51.0 /100 | #173 | Average 5.6% |
| Costa Ricans | 50.0 /100 | #174 | Average 5.6% |
| Shoshone | 49.4 /100 | #175 | Average 5.6% |
| Immigrants | Central America | 49.4 /100 | #176 | Average 5.6% |
| Immigrants | Western Europe | 47.8 /100 | #177 | Average 5.6% |
| Immigrants | Trinidad and Tobago | 47.6 /100 | #178 | Average 5.6% |
| Immigrants | Barbados | 40.5 /100 | #179 | Average 5.6% |
| Immigrants | Uruguay | 37.7 /100 | #180 | Fair 5.6% |
| Immigrants | England | 36.4 /100 | #181 | Fair 5.6% |
| Mexican American Indians | 35.2 /100 | #182 | Fair 5.6% |
| Immigrants | Latin America | 34.3 /100 | #183 | Fair 5.6% |
| Syrians | 33.8 /100 | #184 | Fair 5.6% |
| Immigrants | Mexico | 33.7 /100 | #185 | Fair 5.6% |
| Fijians | 31.7 /100 | #186 | Fair 5.7% |