Immigrants from Asia vs Scottish Male Disability
COMPARE
Immigrants from Asia
Scottish
Male Disability
Male Disability Comparison
Immigrants from Asia
Scottish
10.0%
MALE DISABILITY
100.0/ 100
METRIC RATING
24th/ 347
METRIC RANK
12.8%
MALE DISABILITY
0.0/ 100
METRIC RATING
286th/ 347
METRIC RANK
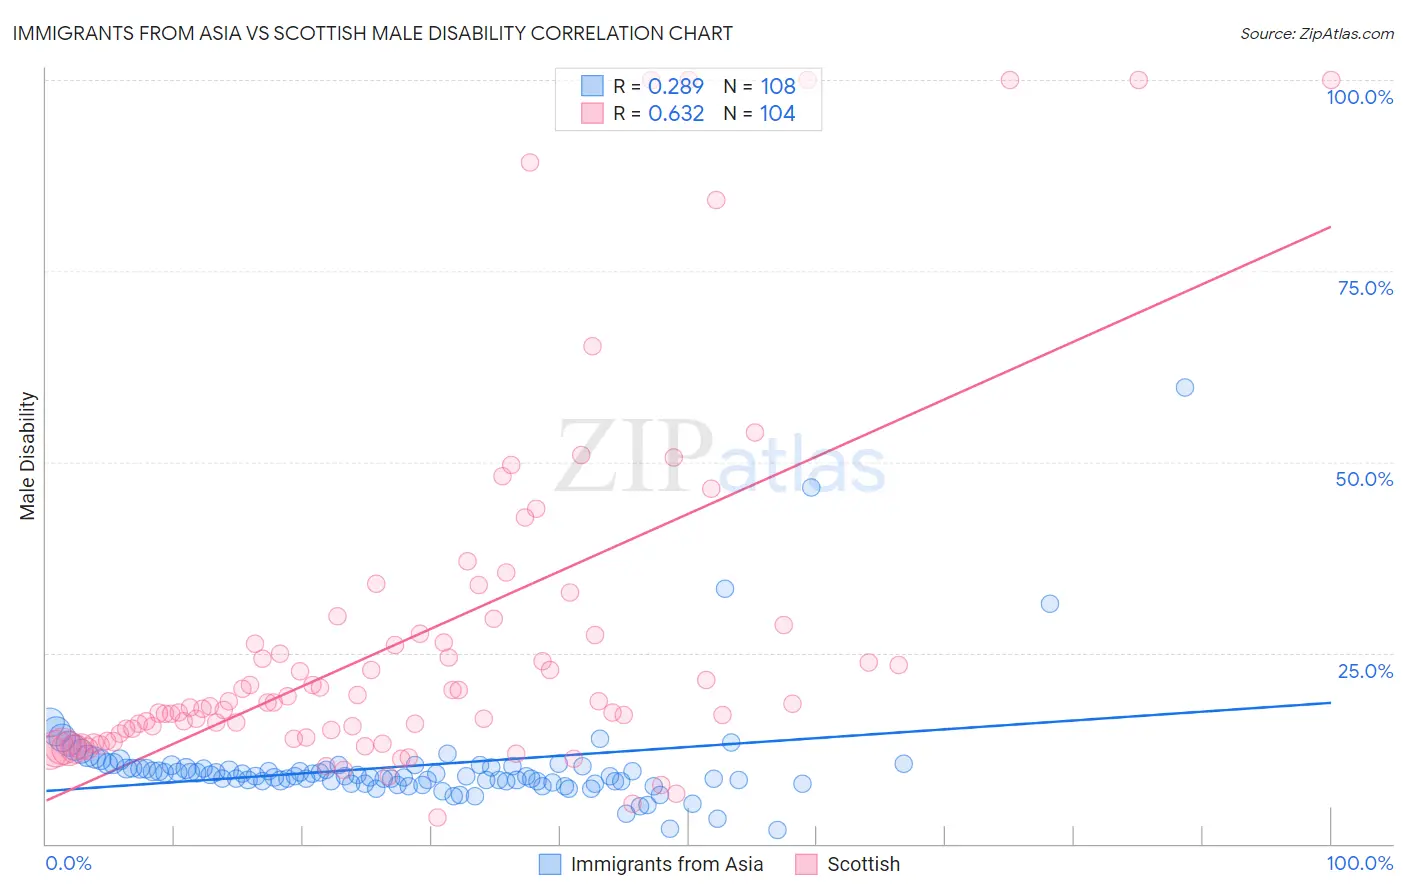
Immigrants from Asia vs Scottish Male Disability Correlation Chart
The statistical analysis conducted on geographies consisting of 548,953,248 people shows a weak positive correlation between the proportion of Immigrants from Asia and percentage of males with a disability in the United States with a correlation coefficient (R) of 0.289 and weighted average of 10.0%. Similarly, the statistical analysis conducted on geographies consisting of 566,868,484 people shows a significant positive correlation between the proportion of Scottish and percentage of males with a disability in the United States with a correlation coefficient (R) of 0.632 and weighted average of 12.8%, a difference of 27.2%.
Male Disability Correlation Summary
| Measurement | Immigrants from Asia | Scottish |
| Minimum | 1.8% | 3.4% |
| Maximum | 59.7% | 100.0% |
| Range | 57.9% | 96.6% |
| Mean | 10.2% | 27.0% |
| Median | 8.9% | 18.4% |
| Interquartile 25% (IQ1) | 8.1% | 14.2% |
| Interquartile 75% (IQ3) | 10.1% | 27.4% |
| Interquartile Range (IQR) | 1.9% | 13.2% |
| Standard Deviation (Sample) | 7.1% | 23.1% |
| Standard Deviation (Population) | 7.1% | 23.0% |
Similar Demographics by Male Disability
Demographics Similar to Immigrants from Asia by Male Disability
In terms of male disability, the demographic groups most similar to Immigrants from Asia are Cypriot (10.0%, a difference of 0.14%), Immigrants from Malaysia (10.0%, a difference of 0.19%), Immigrants from Venezuela (10.0%, a difference of 0.23%), Paraguayan (10.1%, a difference of 0.32%), and Burmese (10.0%, a difference of 0.51%).
| Demographics | Rating | Rank | Male Disability |
| Immigrants | Korea | 100.0 /100 | #17 | Exceptional 9.8% |
| Immigrants | Pakistan | 100.0 /100 | #18 | Exceptional 9.8% |
| Immigrants | Sri Lanka | 100.0 /100 | #19 | Exceptional 10.0% |
| Asians | 100.0 /100 | #20 | Exceptional 10.0% |
| Burmese | 100.0 /100 | #21 | Exceptional 10.0% |
| Immigrants | Venezuela | 100.0 /100 | #22 | Exceptional 10.0% |
| Cypriots | 100.0 /100 | #23 | Exceptional 10.0% |
| Immigrants | Asia | 100.0 /100 | #24 | Exceptional 10.0% |
| Immigrants | Malaysia | 99.9 /100 | #25 | Exceptional 10.0% |
| Paraguayans | 99.9 /100 | #26 | Exceptional 10.1% |
| Egyptians | 99.9 /100 | #27 | Exceptional 10.1% |
| Vietnamese | 99.9 /100 | #28 | Exceptional 10.1% |
| Venezuelans | 99.9 /100 | #29 | Exceptional 10.1% |
| Immigrants | Egypt | 99.9 /100 | #30 | Exceptional 10.1% |
| Soviet Union | 99.9 /100 | #31 | Exceptional 10.1% |
Demographics Similar to Scottish by Male Disability
In terms of male disability, the demographic groups most similar to Scottish are Welsh (12.7%, a difference of 0.050%), Spanish (12.7%, a difference of 0.060%), Cape Verdean (12.8%, a difference of 0.070%), Yup'ik (12.8%, a difference of 0.26%), and German (12.7%, a difference of 0.32%).
| Demographics | Rating | Rank | Male Disability |
| Slovaks | 0.0 /100 | #279 | Tragic 12.7% |
| Dutch | 0.0 /100 | #280 | Tragic 12.7% |
| Sioux | 0.0 /100 | #281 | Tragic 12.7% |
| Irish | 0.0 /100 | #282 | Tragic 12.7% |
| Germans | 0.0 /100 | #283 | Tragic 12.7% |
| Spanish | 0.0 /100 | #284 | Tragic 12.7% |
| Welsh | 0.0 /100 | #285 | Tragic 12.7% |
| Scottish | 0.0 /100 | #286 | Tragic 12.8% |
| Cape Verdeans | 0.0 /100 | #287 | Tragic 12.8% |
| Yup'ik | 0.0 /100 | #288 | Tragic 12.8% |
| Immigrants | Cabo Verde | 0.0 /100 | #289 | Tragic 12.8% |
| Pima | 0.0 /100 | #290 | Tragic 12.8% |
| Whites/Caucasians | 0.0 /100 | #291 | Tragic 12.8% |
| English | 0.0 /100 | #292 | Tragic 12.8% |
| Yaqui | 0.0 /100 | #293 | Tragic 12.9% |