Immigrants from Asia vs Lumbee Nursery School
COMPARE
Immigrants from Asia
Lumbee
Nursery School
Nursery School Comparison
Immigrants from Asia
Lumbee
97.6%
NURSERY SCHOOL
0.7/ 100
METRIC RATING
255th/ 347
METRIC RANK
98.5%
NURSERY SCHOOL
99.9/ 100
METRIC RATING
37th/ 347
METRIC RANK
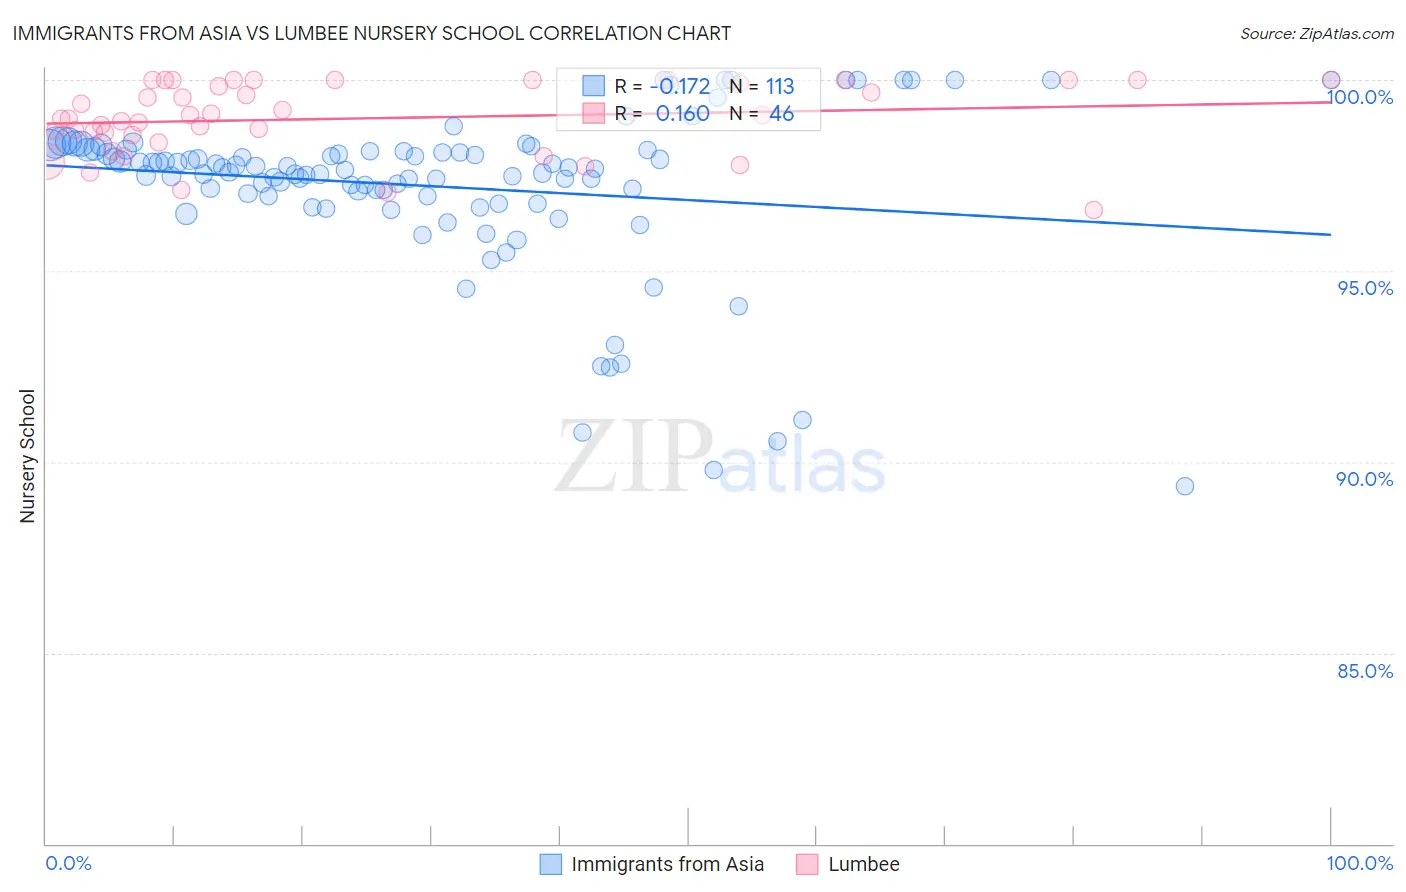
Immigrants from Asia vs Lumbee Nursery School Correlation Chart
The statistical analysis conducted on geographies consisting of 549,170,546 people shows a poor negative correlation between the proportion of Immigrants from Asia and percentage of population with at least nursery school education in the United States with a correlation coefficient (R) of -0.172 and weighted average of 97.6%. Similarly, the statistical analysis conducted on geographies consisting of 92,298,794 people shows a poor positive correlation between the proportion of Lumbee and percentage of population with at least nursery school education in the United States with a correlation coefficient (R) of 0.160 and weighted average of 98.5%, a difference of 0.94%.
Nursery School Correlation Summary
| Measurement | Immigrants from Asia | Lumbee |
| Minimum | 89.4% | 96.6% |
| Maximum | 100.0% | 100.0% |
| Range | 10.6% | 3.4% |
| Mean | 97.2% | 99.0% |
| Median | 97.7% | 99.0% |
| Interquartile 25% (IQ1) | 97.0% | 98.6% |
| Interquartile 75% (IQ3) | 98.2% | 100.0% |
| Interquartile Range (IQR) | 1.2% | 1.4% |
| Standard Deviation (Sample) | 2.1% | 0.93% |
| Standard Deviation (Population) | 2.1% | 0.92% |
Similar Demographics by Nursery School
Demographics Similar to Immigrants from Asia by Nursery School
In terms of nursery school, the demographic groups most similar to Immigrants from Asia are Immigrants from Congo (97.6%, a difference of 0.0%), Ethiopian (97.6%, a difference of 0.010%), Immigrants from Africa (97.6%, a difference of 0.010%), Immigrants from Iraq (97.6%, a difference of 0.010%), and Yaqui (97.6%, a difference of 0.010%).
| Demographics | Rating | Rank | Nursery School |
| Indians (Asian) | 0.9 /100 | #248 | Tragic 97.6% |
| Immigrants | Eastern Africa | 0.9 /100 | #249 | Tragic 97.6% |
| Immigrants | Senegal | 0.9 /100 | #250 | Tragic 97.6% |
| Ethiopians | 0.8 /100 | #251 | Tragic 97.6% |
| Immigrants | Africa | 0.8 /100 | #252 | Tragic 97.6% |
| Immigrants | Iraq | 0.7 /100 | #253 | Tragic 97.6% |
| Immigrants | Congo | 0.7 /100 | #254 | Tragic 97.6% |
| Immigrants | Asia | 0.7 /100 | #255 | Tragic 97.6% |
| Yaqui | 0.6 /100 | #256 | Tragic 97.6% |
| Immigrants | Colombia | 0.6 /100 | #257 | Tragic 97.6% |
| Jamaicans | 0.6 /100 | #258 | Tragic 97.6% |
| Armenians | 0.4 /100 | #259 | Tragic 97.6% |
| Immigrants | South America | 0.4 /100 | #260 | Tragic 97.6% |
| Cubans | 0.4 /100 | #261 | Tragic 97.6% |
| Immigrants | Ethiopia | 0.4 /100 | #262 | Tragic 97.6% |
Demographics Similar to Lumbee by Nursery School
In terms of nursery school, the demographic groups most similar to Lumbee are Italian (98.5%, a difference of 0.0%), Latvian (98.5%, a difference of 0.010%), Chippewa (98.5%, a difference of 0.010%), British (98.5%, a difference of 0.020%), and Luxembourger (98.5%, a difference of 0.020%).
| Demographics | Rating | Rank | Nursery School |
| Europeans | 100.0 /100 | #30 | Exceptional 98.6% |
| Czechs | 100.0 /100 | #31 | Exceptional 98.6% |
| French Canadians | 100.0 /100 | #32 | Exceptional 98.6% |
| Scandinavians | 100.0 /100 | #33 | Exceptional 98.6% |
| Chinese | 100.0 /100 | #34 | Exceptional 98.6% |
| Swiss | 100.0 /100 | #35 | Exceptional 98.6% |
| British | 100.0 /100 | #36 | Exceptional 98.5% |
| Lumbee | 99.9 /100 | #37 | Exceptional 98.5% |
| Italians | 99.9 /100 | #38 | Exceptional 98.5% |
| Latvians | 99.9 /100 | #39 | Exceptional 98.5% |
| Chippewa | 99.9 /100 | #40 | Exceptional 98.5% |
| Luxembourgers | 99.9 /100 | #41 | Exceptional 98.5% |
| Eastern Europeans | 99.9 /100 | #42 | Exceptional 98.5% |
| Native Hawaiians | 99.9 /100 | #43 | Exceptional 98.5% |
| Belgians | 99.9 /100 | #44 | Exceptional 98.5% |