Immigrants from Asia vs Ute Male Disability
COMPARE
Immigrants from Asia
Ute
Male Disability
Male Disability Comparison
Immigrants from Asia
Ute
10.0%
MALE DISABILITY
100.0/ 100
METRIC RATING
24th/ 347
METRIC RANK
11.6%
MALE DISABILITY
9.4/ 100
METRIC RATING
210th/ 347
METRIC RANK
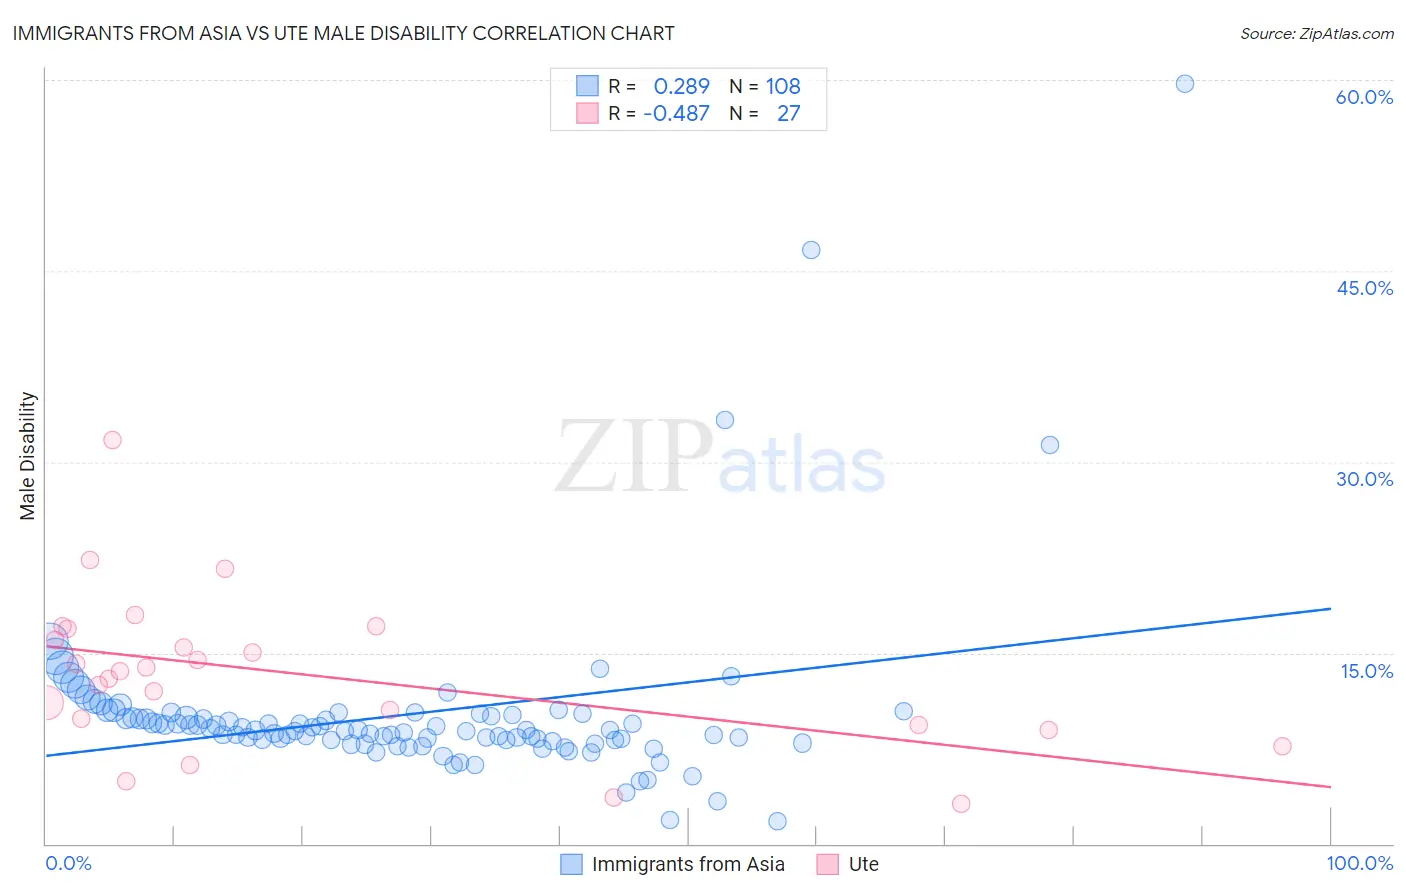
Immigrants from Asia vs Ute Male Disability Correlation Chart
The statistical analysis conducted on geographies consisting of 548,953,248 people shows a weak positive correlation between the proportion of Immigrants from Asia and percentage of males with a disability in the United States with a correlation coefficient (R) of 0.289 and weighted average of 10.0%. Similarly, the statistical analysis conducted on geographies consisting of 55,667,753 people shows a moderate negative correlation between the proportion of Ute and percentage of males with a disability in the United States with a correlation coefficient (R) of -0.487 and weighted average of 11.6%, a difference of 15.4%.
Male Disability Correlation Summary
| Measurement | Immigrants from Asia | Ute |
| Minimum | 1.8% | 3.1% |
| Maximum | 59.7% | 31.7% |
| Range | 57.9% | 28.5% |
| Mean | 10.2% | 13.3% |
| Median | 8.9% | 13.6% |
| Interquartile 25% (IQ1) | 8.1% | 9.3% |
| Interquartile 75% (IQ3) | 10.1% | 16.9% |
| Interquartile Range (IQR) | 1.9% | 7.6% |
| Standard Deviation (Sample) | 7.1% | 6.1% |
| Standard Deviation (Population) | 7.1% | 6.0% |
Similar Demographics by Male Disability
Demographics Similar to Immigrants from Asia by Male Disability
In terms of male disability, the demographic groups most similar to Immigrants from Asia are Cypriot (10.0%, a difference of 0.14%), Immigrants from Malaysia (10.0%, a difference of 0.19%), Immigrants from Venezuela (10.0%, a difference of 0.23%), Paraguayan (10.1%, a difference of 0.32%), and Burmese (10.0%, a difference of 0.51%).
| Demographics | Rating | Rank | Male Disability |
| Immigrants | Korea | 100.0 /100 | #17 | Exceptional 9.8% |
| Immigrants | Pakistan | 100.0 /100 | #18 | Exceptional 9.8% |
| Immigrants | Sri Lanka | 100.0 /100 | #19 | Exceptional 10.0% |
| Asians | 100.0 /100 | #20 | Exceptional 10.0% |
| Burmese | 100.0 /100 | #21 | Exceptional 10.0% |
| Immigrants | Venezuela | 100.0 /100 | #22 | Exceptional 10.0% |
| Cypriots | 100.0 /100 | #23 | Exceptional 10.0% |
| Immigrants | Asia | 100.0 /100 | #24 | Exceptional 10.0% |
| Immigrants | Malaysia | 99.9 /100 | #25 | Exceptional 10.0% |
| Paraguayans | 99.9 /100 | #26 | Exceptional 10.1% |
| Egyptians | 99.9 /100 | #27 | Exceptional 10.1% |
| Vietnamese | 99.9 /100 | #28 | Exceptional 10.1% |
| Venezuelans | 99.9 /100 | #29 | Exceptional 10.1% |
| Immigrants | Egypt | 99.9 /100 | #30 | Exceptional 10.1% |
| Soviet Union | 99.9 /100 | #31 | Exceptional 10.1% |
Demographics Similar to Ute by Male Disability
In terms of male disability, the demographic groups most similar to Ute are Spanish American Indian (11.6%, a difference of 0.10%), Icelander (11.6%, a difference of 0.11%), Immigrants from Somalia (11.5%, a difference of 0.15%), Immigrants from Thailand (11.6%, a difference of 0.17%), and Ukrainian (11.5%, a difference of 0.18%).
| Demographics | Rating | Rank | Male Disability |
| Jamaicans | 10.9 /100 | #203 | Poor 11.5% |
| Immigrants | Cambodia | 10.8 /100 | #204 | Poor 11.5% |
| Serbians | 10.7 /100 | #205 | Poor 11.5% |
| Ukrainians | 10.6 /100 | #206 | Poor 11.5% |
| Immigrants | Somalia | 10.4 /100 | #207 | Poor 11.5% |
| Icelanders | 10.1 /100 | #208 | Poor 11.6% |
| Spanish American Indians | 10.1 /100 | #209 | Poor 11.6% |
| Ute | 9.4 /100 | #210 | Tragic 11.6% |
| Immigrants | Thailand | 8.4 /100 | #211 | Tragic 11.6% |
| Immigrants | Scotland | 8.2 /100 | #212 | Tragic 11.6% |
| Mexican American Indians | 7.8 /100 | #213 | Tragic 11.6% |
| Lithuanians | 6.6 /100 | #214 | Tragic 11.6% |
| Indonesians | 5.9 /100 | #215 | Tragic 11.6% |
| Immigrants | Dominican Republic | 4.9 /100 | #216 | Tragic 11.7% |
| Immigrants | Dominica | 4.6 /100 | #217 | Tragic 11.7% |