Immigrants from Armenia vs Creek Female Poverty Among 25-34 Year Olds
COMPARE
Immigrants from Armenia
Creek
Female Poverty Among 25-34 Year Olds
Female Poverty Among 25-34 Year Olds Comparison
Immigrants from Armenia
Creek
12.6%
FEMALE POVERTY AMONG 25-34 YEAR OLDS
96.9/ 100
METRIC RATING
92nd/ 347
METRIC RANK
19.2%
FEMALE POVERTY AMONG 25-34 YEAR OLDS
0.0/ 100
METRIC RATING
329th/ 347
METRIC RANK
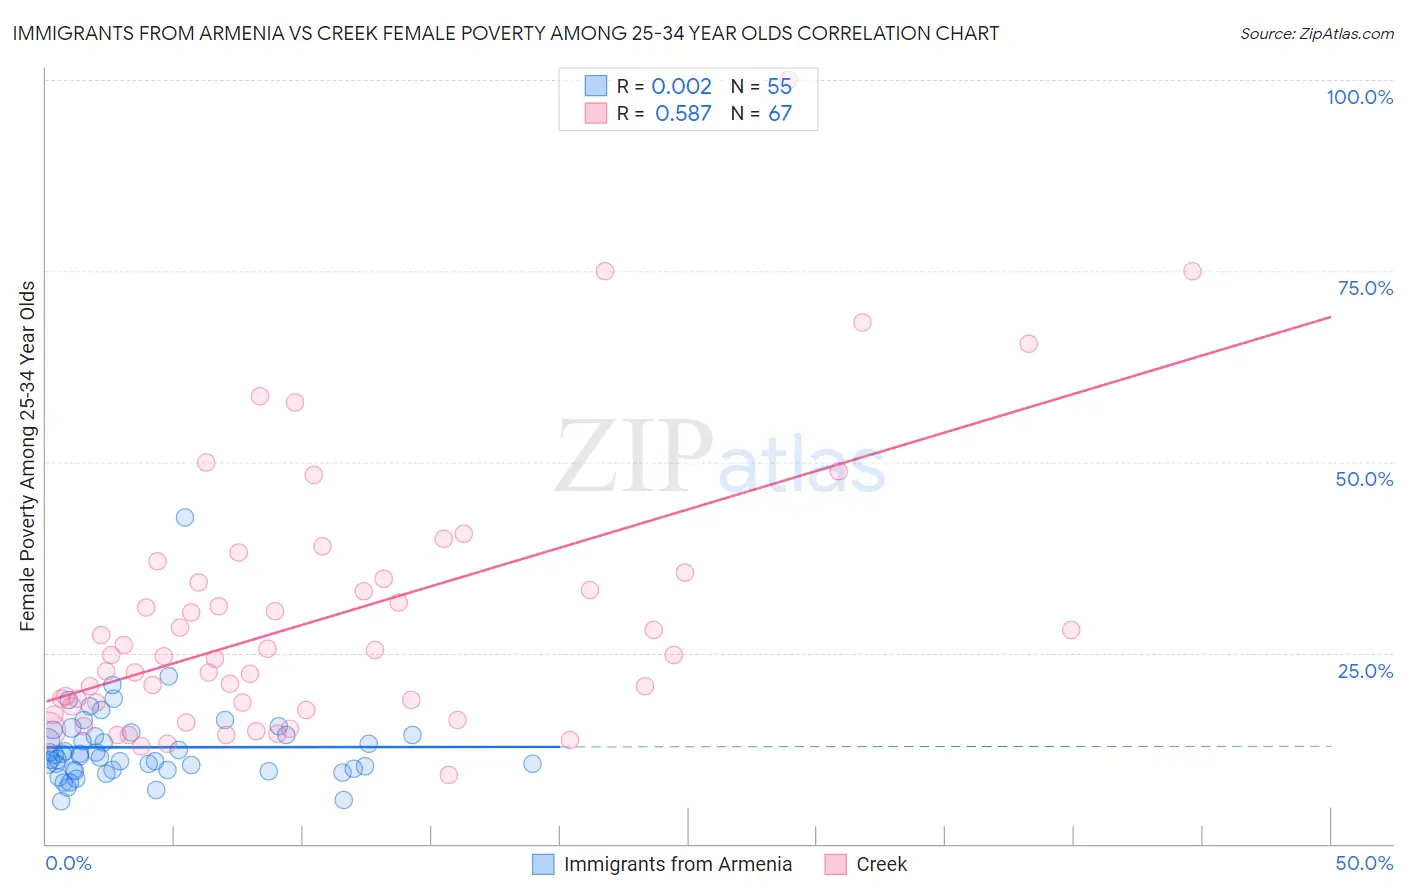
Immigrants from Armenia vs Creek Female Poverty Among 25-34 Year Olds Correlation Chart
The statistical analysis conducted on geographies consisting of 97,252,675 people shows no correlation between the proportion of Immigrants from Armenia and poverty level among females between the ages 25 and 34 in the United States with a correlation coefficient (R) of 0.002 and weighted average of 12.6%. Similarly, the statistical analysis conducted on geographies consisting of 177,502,707 people shows a substantial positive correlation between the proportion of Creek and poverty level among females between the ages 25 and 34 in the United States with a correlation coefficient (R) of 0.587 and weighted average of 19.2%, a difference of 52.5%.
Female Poverty Among 25-34 Year Olds Correlation Summary
| Measurement | Immigrants from Armenia | Creek |
| Minimum | 5.6% | 9.0% |
| Maximum | 42.7% | 100.0% |
| Range | 37.1% | 91.0% |
| Mean | 12.6% | 29.7% |
| Median | 11.5% | 24.7% |
| Interquartile 25% (IQ1) | 9.7% | 18.0% |
| Interquartile 75% (IQ3) | 14.2% | 34.7% |
| Interquartile Range (IQR) | 4.5% | 16.8% |
| Standard Deviation (Sample) | 5.4% | 17.6% |
| Standard Deviation (Population) | 5.4% | 17.4% |
Similar Demographics by Female Poverty Among 25-34 Year Olds
Demographics Similar to Immigrants from Armenia by Female Poverty Among 25-34 Year Olds
In terms of female poverty among 25-34 year olds, the demographic groups most similar to Immigrants from Armenia are Norwegian (12.6%, a difference of 0.010%), Palestinian (12.6%, a difference of 0.030%), Immigrants from France (12.6%, a difference of 0.090%), Immigrants from Albania (12.5%, a difference of 0.11%), and Ukrainian (12.6%, a difference of 0.12%).
| Demographics | Rating | Rank | Female Poverty Among 25-34 Year Olds |
| Immigrants | South Eastern Asia | 97.6 /100 | #85 | Exceptional 12.5% |
| Croatians | 97.5 /100 | #86 | Exceptional 12.5% |
| Argentineans | 97.5 /100 | #87 | Exceptional 12.5% |
| Immigrants | Austria | 97.4 /100 | #88 | Exceptional 12.5% |
| Italians | 97.2 /100 | #89 | Exceptional 12.5% |
| Immigrants | Albania | 97.1 /100 | #90 | Exceptional 12.5% |
| Norwegians | 96.9 /100 | #91 | Exceptional 12.6% |
| Immigrants | Armenia | 96.9 /100 | #92 | Exceptional 12.6% |
| Palestinians | 96.9 /100 | #93 | Exceptional 12.6% |
| Immigrants | France | 96.8 /100 | #94 | Exceptional 12.6% |
| Ukrainians | 96.7 /100 | #95 | Exceptional 12.6% |
| Immigrants | Zimbabwe | 96.7 /100 | #96 | Exceptional 12.6% |
| Immigrants | Northern Africa | 96.6 /100 | #97 | Exceptional 12.6% |
| Immigrants | Ethiopia | 96.5 /100 | #98 | Exceptional 12.6% |
| Immigrants | Argentina | 96.4 /100 | #99 | Exceptional 12.6% |
Demographics Similar to Creek by Female Poverty Among 25-34 Year Olds
In terms of female poverty among 25-34 year olds, the demographic groups most similar to Creek are Alaskan Athabascan (19.1%, a difference of 0.25%), Cheyenne (19.1%, a difference of 0.33%), Black/African American (18.9%, a difference of 1.3%), Paiute (19.6%, a difference of 2.2%), and Kiowa (19.7%, a difference of 2.7%).
| Demographics | Rating | Rank | Female Poverty Among 25-34 Year Olds |
| Central American Indians | 0.0 /100 | #322 | Tragic 18.2% |
| Seminole | 0.0 /100 | #323 | Tragic 18.3% |
| Dutch West Indians | 0.0 /100 | #324 | Tragic 18.4% |
| Inupiat | 0.0 /100 | #325 | Tragic 18.5% |
| Blacks/African Americans | 0.0 /100 | #326 | Tragic 18.9% |
| Cheyenne | 0.0 /100 | #327 | Tragic 19.1% |
| Alaskan Athabascans | 0.0 /100 | #328 | Tragic 19.1% |
| Creek | 0.0 /100 | #329 | Tragic 19.2% |
| Paiute | 0.0 /100 | #330 | Tragic 19.6% |
| Kiowa | 0.0 /100 | #331 | Tragic 19.7% |
| Immigrants | Yemen | 0.0 /100 | #332 | Tragic 19.8% |
| Cajuns | 0.0 /100 | #333 | Tragic 19.9% |
| Apache | 0.0 /100 | #334 | Tragic 20.1% |
| Natives/Alaskans | 0.0 /100 | #335 | Tragic 20.3% |
| Pueblo | 0.0 /100 | #336 | Tragic 22.2% |