Immigrants from Armenia vs Creek Family Poverty
COMPARE
Immigrants from Armenia
Creek
Family Poverty
Family Poverty Comparison
Immigrants from Armenia
Creek
10.0%
FAMILY POVERTY
3.3/ 100
METRIC RATING
227th/ 347
METRIC RANK
11.7%
FAMILY POVERTY
0.0/ 100
METRIC RATING
297th/ 347
METRIC RANK
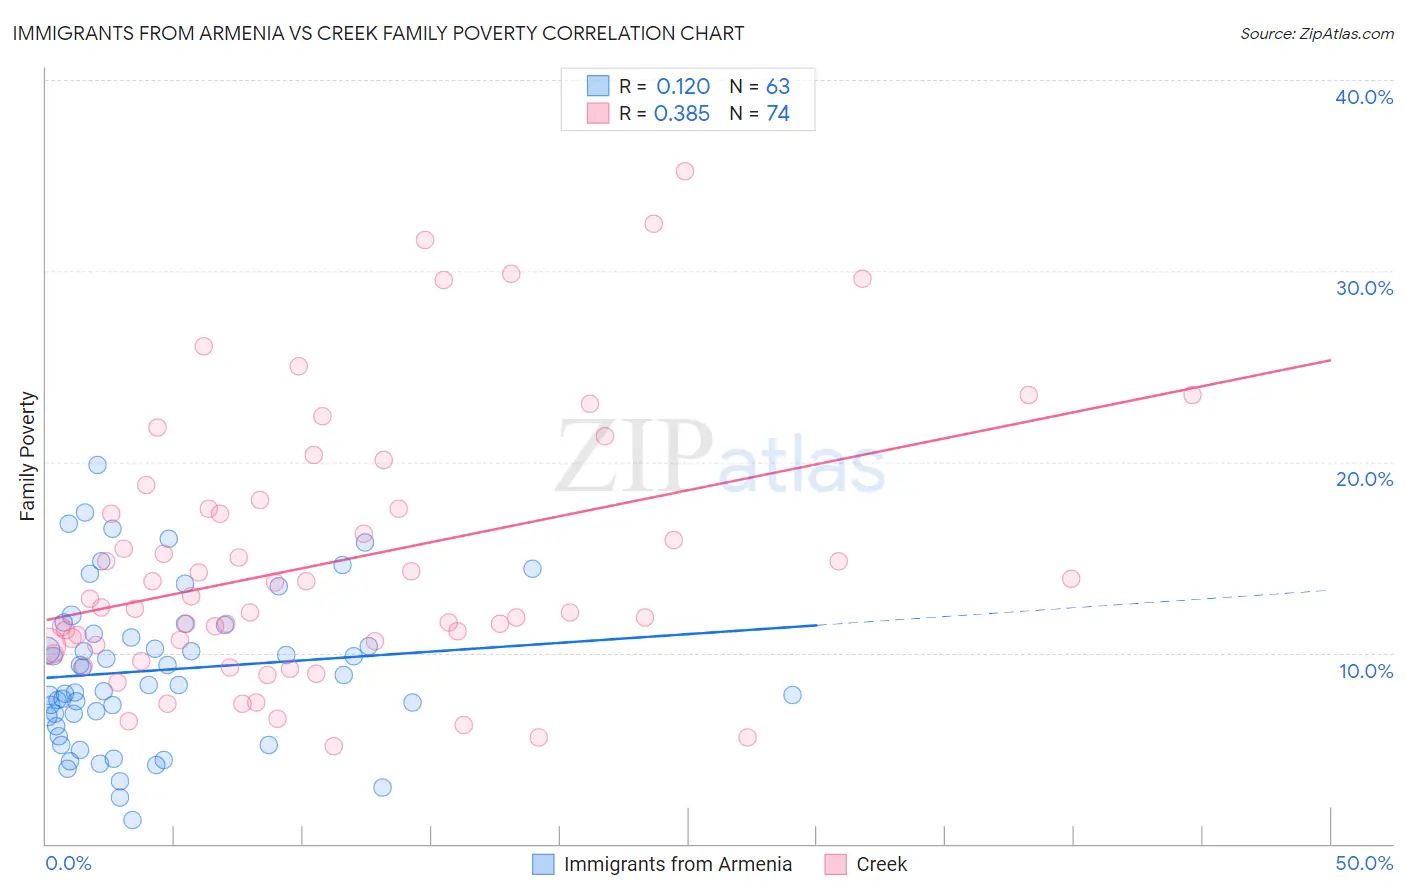
Immigrants from Armenia vs Creek Family Poverty Correlation Chart
The statistical analysis conducted on geographies consisting of 97,632,131 people shows a poor positive correlation between the proportion of Immigrants from Armenia and poverty level among families in the United States with a correlation coefficient (R) of 0.120 and weighted average of 10.0%. Similarly, the statistical analysis conducted on geographies consisting of 178,327,636 people shows a mild positive correlation between the proportion of Creek and poverty level among families in the United States with a correlation coefficient (R) of 0.385 and weighted average of 11.7%, a difference of 16.5%.
Family Poverty Correlation Summary
| Measurement | Immigrants from Armenia | Creek |
| Minimum | 1.2% | 5.1% |
| Maximum | 19.9% | 35.2% |
| Range | 18.6% | 30.1% |
| Mean | 9.1% | 14.8% |
| Median | 8.3% | 12.6% |
| Interquartile 25% (IQ1) | 6.7% | 10.4% |
| Interquartile 75% (IQ3) | 11.5% | 17.6% |
| Interquartile Range (IQR) | 4.8% | 7.2% |
| Standard Deviation (Sample) | 4.1% | 7.0% |
| Standard Deviation (Population) | 4.0% | 6.9% |
Similar Demographics by Family Poverty
Demographics Similar to Immigrants from Armenia by Family Poverty
In terms of family poverty, the demographic groups most similar to Immigrants from Armenia are Ottawa (10.0%, a difference of 0.020%), Sudanese (10.0%, a difference of 0.20%), Immigrants from Uzbekistan (10.0%, a difference of 0.21%), Immigrants from Panama (10.0%, a difference of 0.23%), and Immigrants (10.0%, a difference of 0.29%).
| Demographics | Rating | Rank | Family Poverty |
| Bermudans | 5.3 /100 | #220 | Tragic 9.9% |
| Immigrants | Cambodia | 4.8 /100 | #221 | Tragic 9.9% |
| Japanese | 4.8 /100 | #222 | Tragic 9.9% |
| Immigrants | Africa | 4.3 /100 | #223 | Tragic 9.9% |
| Marshallese | 3.9 /100 | #224 | Tragic 9.9% |
| Immigrants | Immigrants | 3.6 /100 | #225 | Tragic 10.0% |
| Ottawa | 3.3 /100 | #226 | Tragic 10.0% |
| Immigrants | Armenia | 3.3 /100 | #227 | Tragic 10.0% |
| Sudanese | 3.1 /100 | #228 | Tragic 10.0% |
| Immigrants | Uzbekistan | 3.1 /100 | #229 | Tragic 10.0% |
| Immigrants | Panama | 3.1 /100 | #230 | Tragic 10.0% |
| Alaskan Athabascans | 2.7 /100 | #231 | Tragic 10.1% |
| Immigrants | Sudan | 2.3 /100 | #232 | Tragic 10.1% |
| Fijians | 2.1 /100 | #233 | Tragic 10.1% |
| Immigrants | Middle Africa | 2.1 /100 | #234 | Tragic 10.1% |
Demographics Similar to Creek by Family Poverty
In terms of family poverty, the demographic groups most similar to Creek are Immigrants from Senegal (11.7%, a difference of 0.14%), Choctaw (11.6%, a difference of 0.23%), Dutch West Indian (11.7%, a difference of 0.24%), Immigrants from Bangladesh (11.7%, a difference of 0.25%), and Immigrants from Haiti (11.6%, a difference of 0.28%).
| Demographics | Rating | Rank | Family Poverty |
| West Indians | 0.0 /100 | #290 | Tragic 11.5% |
| Haitians | 0.0 /100 | #291 | Tragic 11.5% |
| Immigrants | Somalia | 0.0 /100 | #292 | Tragic 11.5% |
| Immigrants | Cabo Verde | 0.0 /100 | #293 | Tragic 11.6% |
| Immigrants | St. Vincent and the Grenadines | 0.0 /100 | #294 | Tragic 11.6% |
| Immigrants | Haiti | 0.0 /100 | #295 | Tragic 11.6% |
| Choctaw | 0.0 /100 | #296 | Tragic 11.6% |
| Creek | 0.0 /100 | #297 | Tragic 11.7% |
| Immigrants | Senegal | 0.0 /100 | #298 | Tragic 11.7% |
| Dutch West Indians | 0.0 /100 | #299 | Tragic 11.7% |
| Immigrants | Bangladesh | 0.0 /100 | #300 | Tragic 11.7% |
| Bahamians | 0.0 /100 | #301 | Tragic 11.7% |
| Guatemalans | 0.0 /100 | #302 | Tragic 11.7% |
| Africans | 0.0 /100 | #303 | Tragic 11.8% |
| Immigrants | Latin America | 0.0 /100 | #304 | Tragic 11.8% |