Houma vs Thai 8th Grade
COMPARE
Houma
Thai
8th Grade
8th Grade Comparison
Houma
Thais
94.2%
8TH GRADE
0.0/ 100
METRIC RATING
294th/ 347
METRIC RANK
96.4%
8TH GRADE
98.9/ 100
METRIC RATING
91st/ 347
METRIC RANK
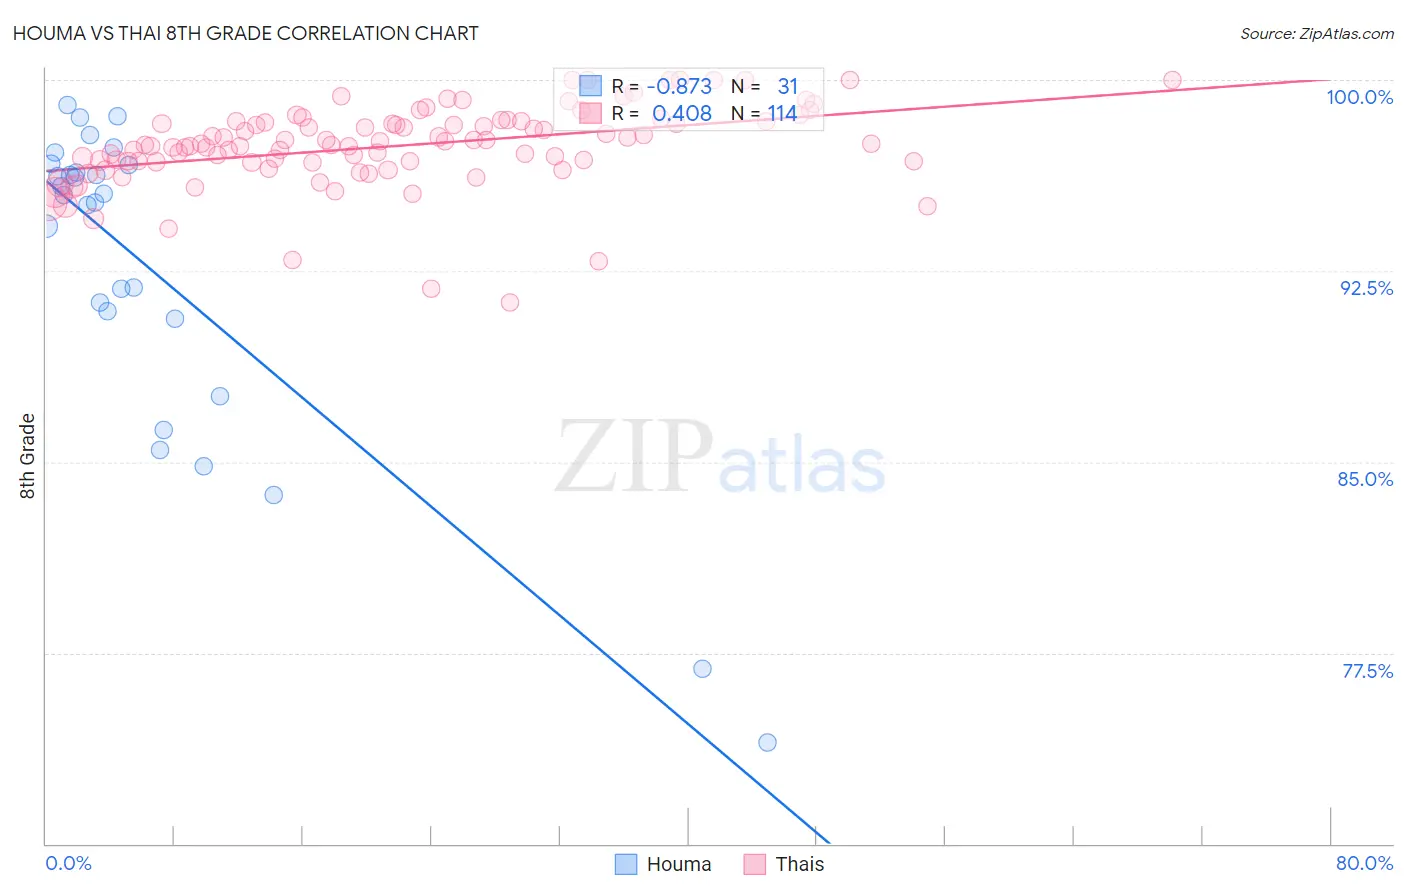
Houma vs Thai 8th Grade Correlation Chart
The statistical analysis conducted on geographies consisting of 36,795,916 people shows a very strong negative correlation between the proportion of Houma and percentage of population with at least 8th grade education in the United States with a correlation coefficient (R) of -0.873 and weighted average of 94.2%. Similarly, the statistical analysis conducted on geographies consisting of 475,814,962 people shows a moderate positive correlation between the proportion of Thais and percentage of population with at least 8th grade education in the United States with a correlation coefficient (R) of 0.408 and weighted average of 96.4%, a difference of 2.3%.
8th Grade Correlation Summary
| Measurement | Houma | Thai |
| Minimum | 74.0% | 91.3% |
| Maximum | 99.0% | 100.0% |
| Range | 25.0% | 8.7% |
| Mean | 92.6% | 97.4% |
| Median | 95.5% | 97.5% |
| Interquartile 25% (IQ1) | 90.6% | 96.8% |
| Interquartile 75% (IQ3) | 96.7% | 98.4% |
| Interquartile Range (IQR) | 6.0% | 1.6% |
| Standard Deviation (Sample) | 6.3% | 1.6% |
| Standard Deviation (Population) | 6.2% | 1.6% |
Similar Demographics by 8th Grade
Demographics Similar to Houma by 8th Grade
In terms of 8th grade, the demographic groups most similar to Houma are Yaqui (94.2%, a difference of 0.0%), Fijian (94.2%, a difference of 0.010%), Bangladeshi (94.3%, a difference of 0.030%), Haitian (94.2%, a difference of 0.030%), and Immigrants from South Eastern Asia (94.2%, a difference of 0.040%).
| Demographics | Rating | Rank | 8th Grade |
| Tohono O'odham | 0.0 /100 | #287 | Tragic 94.5% |
| Malaysians | 0.0 /100 | #288 | Tragic 94.5% |
| British West Indians | 0.0 /100 | #289 | Tragic 94.4% |
| Immigrants | West Indies | 0.0 /100 | #290 | Tragic 94.3% |
| Immigrants | Grenada | 0.0 /100 | #291 | Tragic 94.3% |
| Bangladeshis | 0.0 /100 | #292 | Tragic 94.3% |
| Yaqui | 0.0 /100 | #293 | Tragic 94.2% |
| Houma | 0.0 /100 | #294 | Tragic 94.2% |
| Fijians | 0.0 /100 | #295 | Tragic 94.2% |
| Haitians | 0.0 /100 | #296 | Tragic 94.2% |
| Immigrants | South Eastern Asia | 0.0 /100 | #297 | Tragic 94.2% |
| Indonesians | 0.0 /100 | #298 | Tragic 94.1% |
| Cubans | 0.0 /100 | #299 | Tragic 94.1% |
| Immigrants | Burma/Myanmar | 0.0 /100 | #300 | Tragic 94.1% |
| Immigrants | Laos | 0.0 /100 | #301 | Tragic 94.1% |
Demographics Similar to Thais by 8th Grade
In terms of 8th grade, the demographic groups most similar to Thais are Immigrants from Sweden (96.4%, a difference of 0.0%), Menominee (96.4%, a difference of 0.0%), Immigrants from Denmark (96.4%, a difference of 0.0%), Chickasaw (96.4%, a difference of 0.010%), and Immigrants from Singapore (96.4%, a difference of 0.010%).
| Demographics | Rating | Rank | 8th Grade |
| Immigrants | Belgium | 99.1 /100 | #84 | Exceptional 96.5% |
| Immigrants | South Africa | 99.1 /100 | #85 | Exceptional 96.5% |
| Cherokee | 99.0 /100 | #86 | Exceptional 96.5% |
| Immigrants | Australia | 99.0 /100 | #87 | Exceptional 96.5% |
| Immigrants | Western Europe | 99.0 /100 | #88 | Exceptional 96.4% |
| Chickasaw | 98.9 /100 | #89 | Exceptional 96.4% |
| Immigrants | Sweden | 98.9 /100 | #90 | Exceptional 96.4% |
| Thais | 98.9 /100 | #91 | Exceptional 96.4% |
| Menominee | 98.9 /100 | #92 | Exceptional 96.4% |
| Immigrants | Denmark | 98.8 /100 | #93 | Exceptional 96.4% |
| Immigrants | Singapore | 98.8 /100 | #94 | Exceptional 96.4% |
| German Russians | 98.8 /100 | #95 | Exceptional 96.4% |
| Potawatomi | 98.7 /100 | #96 | Exceptional 96.4% |
| Osage | 98.7 /100 | #97 | Exceptional 96.4% |
| Immigrants | Germany | 98.7 /100 | #98 | Exceptional 96.4% |