Portuguese vs Thai Vision Disability
COMPARE
Portuguese
Thai
Vision Disability
Vision Disability Comparison
Portuguese
Thais
2.3%
VISION DISABILITY
4.9/ 100
METRIC RATING
218th/ 347
METRIC RANK
1.7%
VISION DISABILITY
100.0/ 100
METRIC RATING
4th/ 347
METRIC RANK
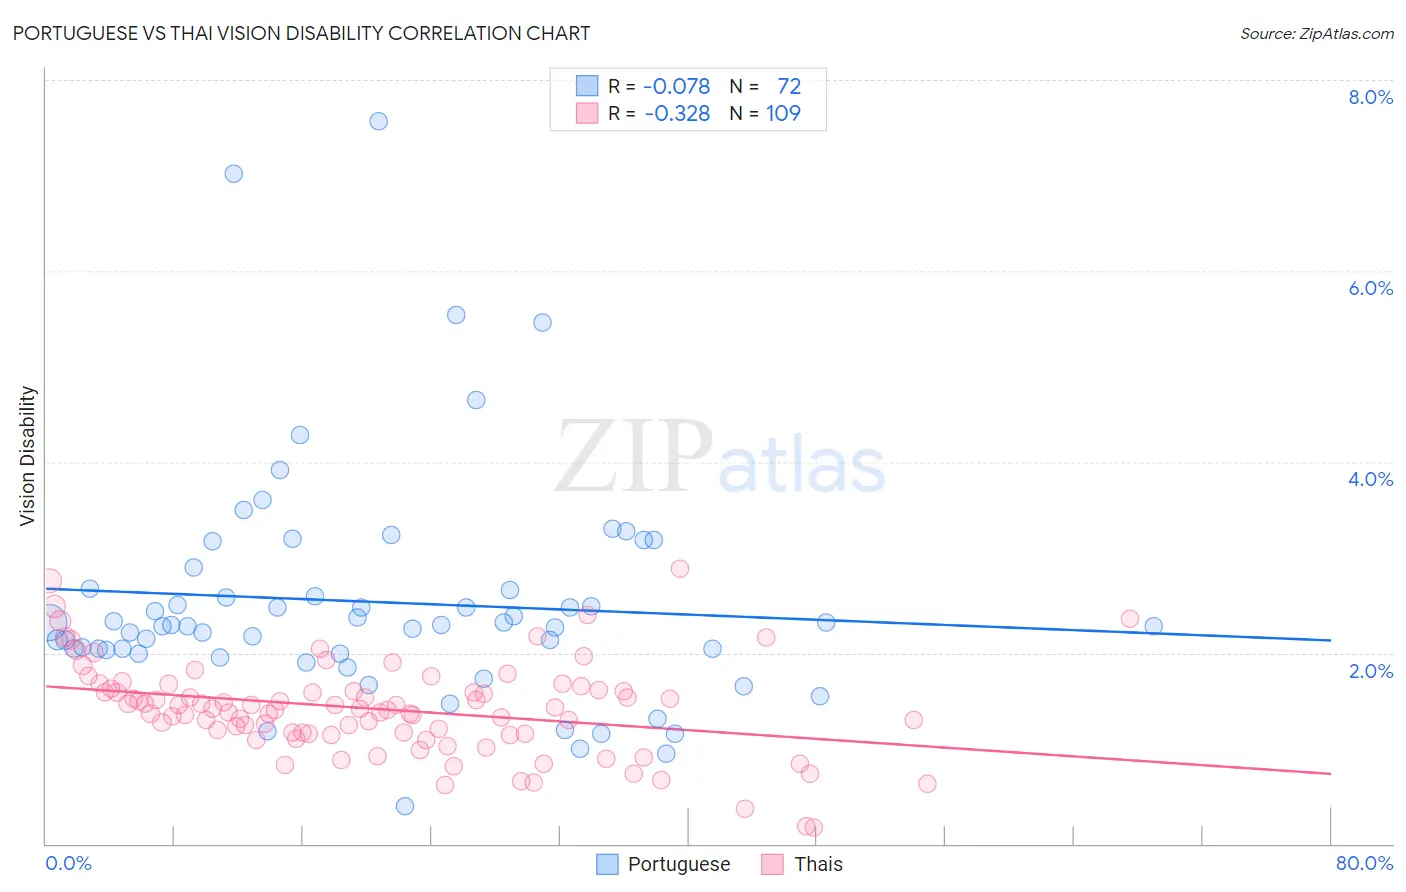
Portuguese vs Thai Vision Disability Correlation Chart
The statistical analysis conducted on geographies consisting of 449,734,569 people shows a slight negative correlation between the proportion of Portuguese and percentage of population with vision disability in the United States with a correlation coefficient (R) of -0.078 and weighted average of 2.3%. Similarly, the statistical analysis conducted on geographies consisting of 475,304,455 people shows a mild negative correlation between the proportion of Thais and percentage of population with vision disability in the United States with a correlation coefficient (R) of -0.328 and weighted average of 1.7%, a difference of 30.2%.
Vision Disability Correlation Summary
| Measurement | Portuguese | Thai |
| Minimum | 0.39% | 0.17% |
| Maximum | 7.6% | 2.9% |
| Range | 7.2% | 2.7% |
| Mean | 2.5% | 1.4% |
| Median | 2.3% | 1.4% |
| Interquartile 25% (IQ1) | 2.0% | 1.2% |
| Interquartile 75% (IQ3) | 2.7% | 1.6% |
| Interquartile Range (IQR) | 0.65% | 0.47% |
| Standard Deviation (Sample) | 1.2% | 0.49% |
| Standard Deviation (Population) | 1.2% | 0.48% |
Similar Demographics by Vision Disability
Demographics Similar to Portuguese by Vision Disability
In terms of vision disability, the demographic groups most similar to Portuguese are Barbadian (2.3%, a difference of 0.070%), Ecuadorian (2.3%, a difference of 0.11%), Immigrants from Trinidad and Tobago (2.3%, a difference of 0.34%), Guamanian/Chamorro (2.3%, a difference of 0.35%), and French Canadian (2.3%, a difference of 0.36%).
| Demographics | Rating | Rank | Vision Disability |
| Indonesians | 9.5 /100 | #211 | Tragic 2.2% |
| Bermudans | 9.0 /100 | #212 | Tragic 2.2% |
| Immigrants | Ghana | 8.9 /100 | #213 | Tragic 2.2% |
| Trinidadians and Tobagonians | 8.2 /100 | #214 | Tragic 2.2% |
| Nigerians | 7.2 /100 | #215 | Tragic 2.3% |
| Immigrants | Trinidad and Tobago | 6.1 /100 | #216 | Tragic 2.3% |
| Barbadians | 5.1 /100 | #217 | Tragic 2.3% |
| Portuguese | 4.9 /100 | #218 | Tragic 2.3% |
| Ecuadorians | 4.6 /100 | #219 | Tragic 2.3% |
| Guamanians/Chamorros | 3.9 /100 | #220 | Tragic 2.3% |
| French Canadians | 3.9 /100 | #221 | Tragic 2.3% |
| Immigrants | Senegal | 3.8 /100 | #222 | Tragic 2.3% |
| Basques | 3.5 /100 | #223 | Tragic 2.3% |
| Irish | 3.4 /100 | #224 | Tragic 2.3% |
| Immigrants | Western Africa | 3.4 /100 | #225 | Tragic 2.3% |
Demographics Similar to Thais by Vision Disability
In terms of vision disability, the demographic groups most similar to Thais are Okinawan (1.8%, a difference of 1.9%), Immigrants from Iran (1.8%, a difference of 2.5%), Immigrants from South Central Asia (1.8%, a difference of 2.6%), Immigrants from Taiwan (1.7%, a difference of 2.6%), and Iranian (1.8%, a difference of 2.7%).
| Demographics | Rating | Rank | Vision Disability |
| Immigrants | India | 100.0 /100 | #1 | Exceptional 1.7% |
| Filipinos | 100.0 /100 | #2 | Exceptional 1.7% |
| Immigrants | Taiwan | 100.0 /100 | #3 | Exceptional 1.7% |
| Thais | 100.0 /100 | #4 | Exceptional 1.7% |
| Okinawans | 100.0 /100 | #5 | Exceptional 1.8% |
| Immigrants | Iran | 100.0 /100 | #6 | Exceptional 1.8% |
| Immigrants | South Central Asia | 100.0 /100 | #7 | Exceptional 1.8% |
| Iranians | 100.0 /100 | #8 | Exceptional 1.8% |
| Immigrants | Singapore | 100.0 /100 | #9 | Exceptional 1.8% |
| Immigrants | Hong Kong | 100.0 /100 | #10 | Exceptional 1.8% |
| Immigrants | Israel | 100.0 /100 | #11 | Exceptional 1.8% |
| Immigrants | Korea | 100.0 /100 | #12 | Exceptional 1.8% |
| Immigrants | Eastern Asia | 100.0 /100 | #13 | Exceptional 1.8% |
| Immigrants | China | 100.0 /100 | #14 | Exceptional 1.8% |
| Immigrants | Bolivia | 100.0 /100 | #15 | Exceptional 1.8% |