Houma vs Thai Unemployment Among Youth under 25 years
COMPARE
Houma
Thai
Unemployment Among Youth under 25 years
Unemployment Among Youth under 25 years Comparison
Houma
Thais
13.8%
UNEMPLOYMENT AMONG YOUTH UNDER 25 YEARS
0.0/ 100
METRIC RATING
304th/ 347
METRIC RANK
11.0%
UNEMPLOYMENT AMONG YOUTH UNDER 25 YEARS
99.3/ 100
METRIC RATING
49th/ 347
METRIC RANK
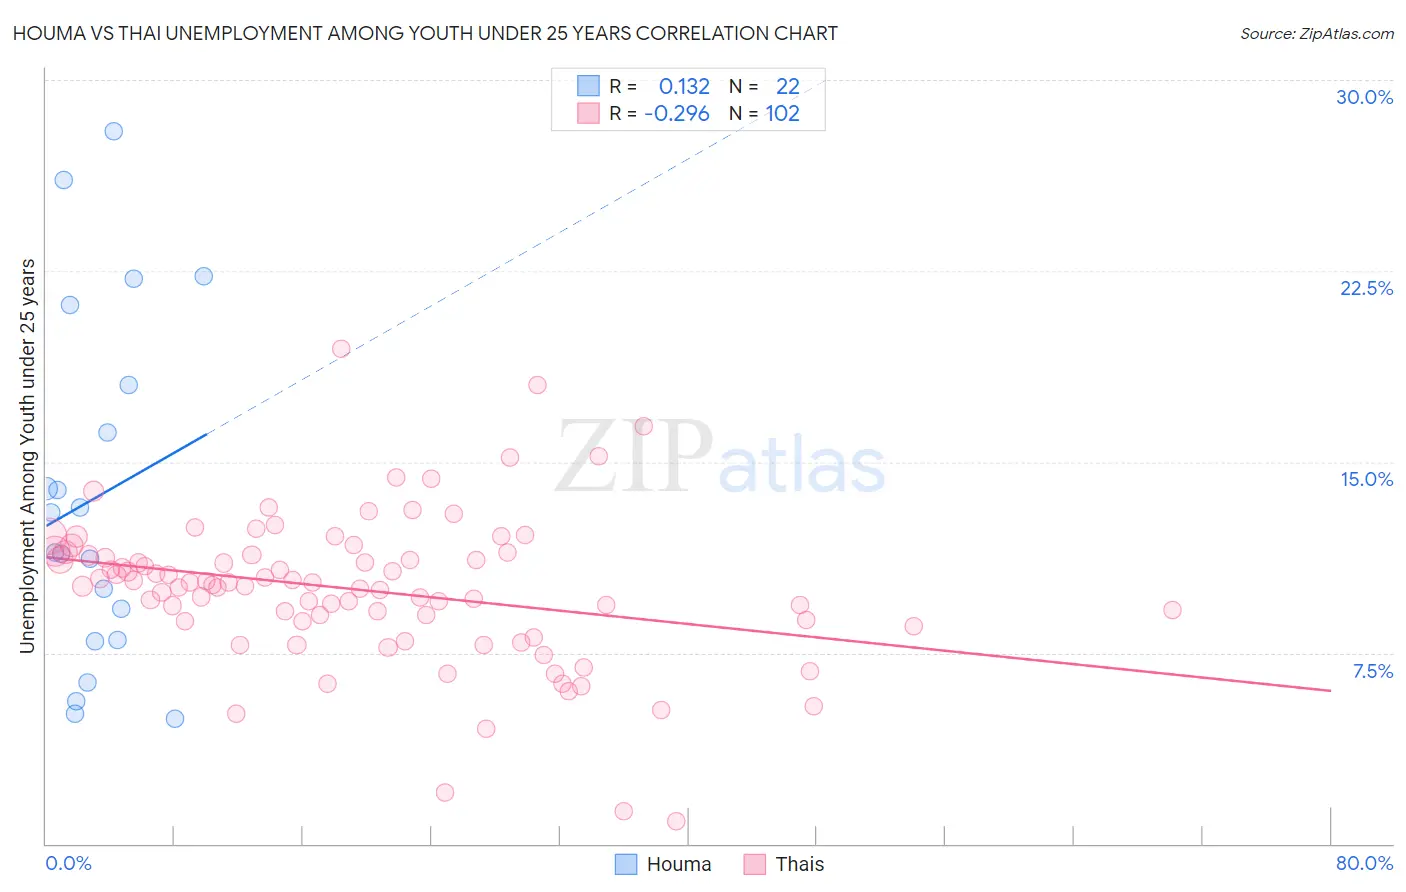
Houma vs Thai Unemployment Among Youth under 25 years Correlation Chart
The statistical analysis conducted on geographies consisting of 36,647,392 people shows a poor positive correlation between the proportion of Houma and unemployment rate among youth under the age of 25 in the United States with a correlation coefficient (R) of 0.132 and weighted average of 13.8%. Similarly, the statistical analysis conducted on geographies consisting of 468,363,395 people shows a weak negative correlation between the proportion of Thais and unemployment rate among youth under the age of 25 in the United States with a correlation coefficient (R) of -0.296 and weighted average of 11.0%, a difference of 25.6%.
Unemployment Among Youth under 25 years Correlation Summary
| Measurement | Houma | Thai |
| Minimum | 4.9% | 0.90% |
| Maximum | 28.0% | 19.4% |
| Range | 23.1% | 18.5% |
| Mean | 13.6% | 10.0% |
| Median | 12.2% | 10.2% |
| Interquartile 25% (IQ1) | 8.0% | 8.7% |
| Interquartile 75% (IQ3) | 18.0% | 11.3% |
| Interquartile Range (IQR) | 10.0% | 2.6% |
| Standard Deviation (Sample) | 6.8% | 3.0% |
| Standard Deviation (Population) | 6.6% | 2.9% |
Similar Demographics by Unemployment Among Youth under 25 years
Demographics Similar to Houma by Unemployment Among Youth under 25 years
In terms of unemployment among youth under 25 years, the demographic groups most similar to Houma are Belizean (13.8%, a difference of 0.010%), Immigrants from Sierra Leone (13.8%, a difference of 0.040%), Immigrants from Senegal (13.8%, a difference of 0.090%), Immigrants from Cabo Verde (13.8%, a difference of 0.26%), and Haitian (13.9%, a difference of 0.33%).
| Demographics | Rating | Rank | Unemployment Among Youth under 25 years |
| U.S. Virgin Islanders | 0.0 /100 | #297 | Tragic 13.6% |
| Shoshone | 0.0 /100 | #298 | Tragic 13.7% |
| Tohono O'odham | 0.0 /100 | #299 | Tragic 13.8% |
| Immigrants | Cabo Verde | 0.0 /100 | #300 | Tragic 13.8% |
| Immigrants | Senegal | 0.0 /100 | #301 | Tragic 13.8% |
| Immigrants | Sierra Leone | 0.0 /100 | #302 | Tragic 13.8% |
| Belizeans | 0.0 /100 | #303 | Tragic 13.8% |
| Houma | 0.0 /100 | #304 | Tragic 13.8% |
| Haitians | 0.0 /100 | #305 | Tragic 13.9% |
| Pueblo | 0.0 /100 | #306 | Tragic 13.9% |
| Immigrants | Haiti | 0.0 /100 | #307 | Tragic 14.0% |
| Immigrants | Belize | 0.0 /100 | #308 | Tragic 14.0% |
| Aleuts | 0.0 /100 | #309 | Tragic 14.1% |
| Immigrants | West Indies | 0.0 /100 | #310 | Tragic 14.2% |
| Immigrants | Bangladesh | 0.0 /100 | #311 | Tragic 14.2% |
Demographics Similar to Thais by Unemployment Among Youth under 25 years
In terms of unemployment among youth under 25 years, the demographic groups most similar to Thais are Polish (11.0%, a difference of 0.070%), Czechoslovakian (11.0%, a difference of 0.090%), Serbian (11.0%, a difference of 0.33%), Latvian (11.0%, a difference of 0.34%), and Ottawa (11.1%, a difference of 0.43%).
| Demographics | Rating | Rank | Unemployment Among Youth under 25 years |
| Cambodians | 99.7 /100 | #42 | Exceptional 10.9% |
| British | 99.7 /100 | #43 | Exceptional 10.9% |
| Welsh | 99.7 /100 | #44 | Exceptional 10.9% |
| Bulgarians | 99.6 /100 | #45 | Exceptional 10.9% |
| Tongans | 99.6 /100 | #46 | Exceptional 10.9% |
| Australians | 99.6 /100 | #47 | Exceptional 10.9% |
| Poles | 99.3 /100 | #48 | Exceptional 11.0% |
| Thais | 99.3 /100 | #49 | Exceptional 11.0% |
| Czechoslovakians | 99.2 /100 | #50 | Exceptional 11.0% |
| Serbians | 99.0 /100 | #51 | Exceptional 11.0% |
| Latvians | 99.0 /100 | #52 | Exceptional 11.0% |
| Ottawa | 99.0 /100 | #53 | Exceptional 11.1% |
| Mongolians | 98.9 /100 | #54 | Exceptional 11.1% |
| Irish | 98.9 /100 | #55 | Exceptional 11.1% |
| Immigrants | Saudi Arabia | 98.8 /100 | #56 | Exceptional 11.1% |