Honduran vs Immigrants from Uruguay Ambulatory Disability
COMPARE
Honduran
Immigrants from Uruguay
Ambulatory Disability
Ambulatory Disability Comparison
Hondurans
Immigrants from Uruguay
6.3%
AMBULATORY DISABILITY
6.3/ 100
METRIC RATING
225th/ 347
METRIC RANK
5.9%
AMBULATORY DISABILITY
95.6/ 100
METRIC RATING
113th/ 347
METRIC RANK
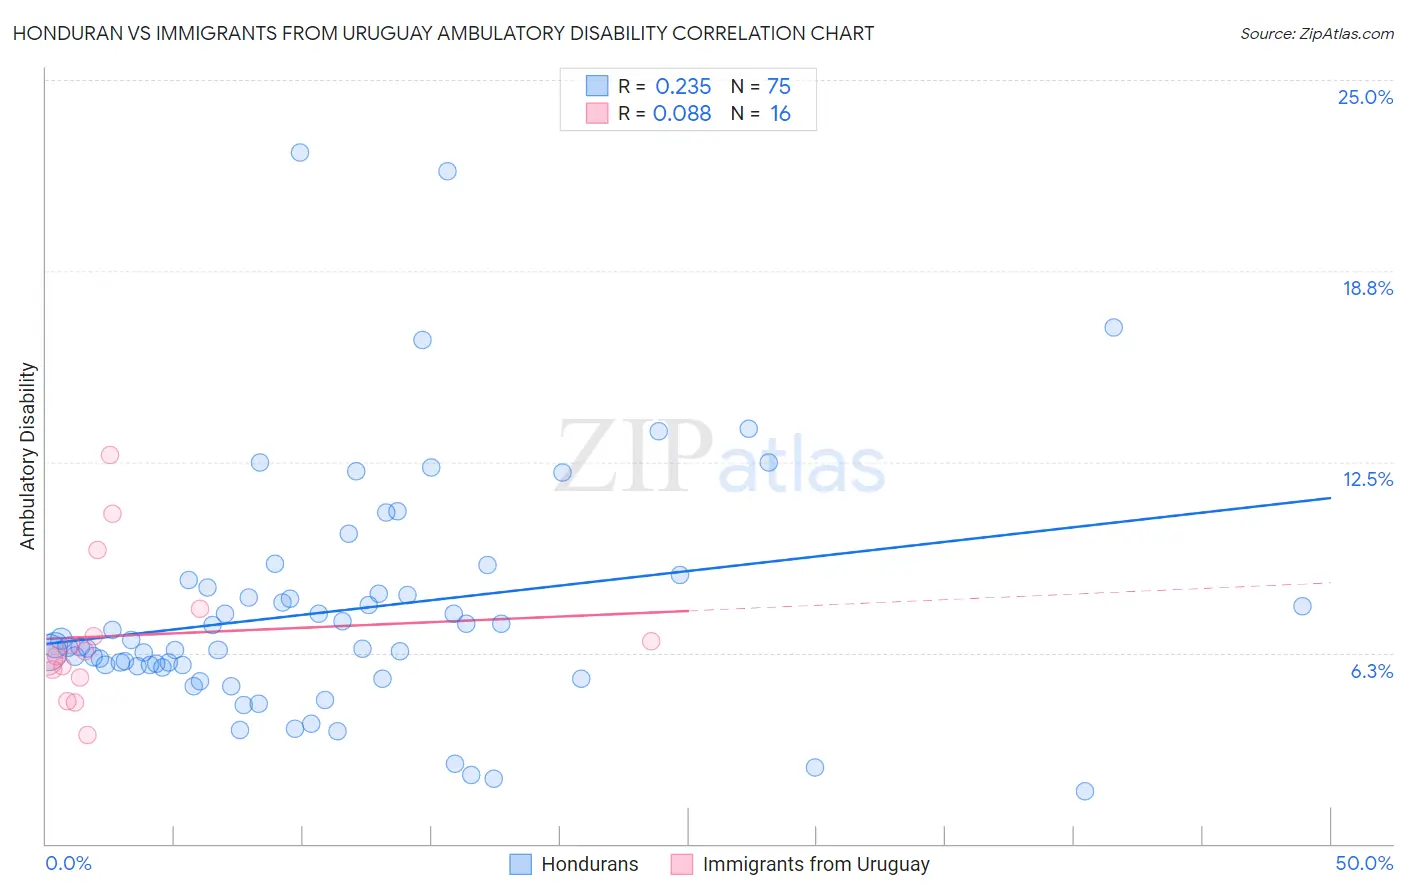
Honduran vs Immigrants from Uruguay Ambulatory Disability Correlation Chart
The statistical analysis conducted on geographies consisting of 357,719,276 people shows a weak positive correlation between the proportion of Hondurans and percentage of population with ambulatory disability in the United States with a correlation coefficient (R) of 0.235 and weighted average of 6.3%. Similarly, the statistical analysis conducted on geographies consisting of 133,255,356 people shows a slight positive correlation between the proportion of Immigrants from Uruguay and percentage of population with ambulatory disability in the United States with a correlation coefficient (R) of 0.088 and weighted average of 5.9%, a difference of 8.0%.
Ambulatory Disability Correlation Summary
| Measurement | Honduran | Immigrants from Uruguay |
| Minimum | 1.7% | 3.6% |
| Maximum | 22.6% | 12.7% |
| Range | 20.9% | 9.2% |
| Mean | 7.6% | 6.8% |
| Median | 6.4% | 6.2% |
| Interquartile 25% (IQ1) | 5.8% | 5.6% |
| Interquartile 75% (IQ3) | 8.4% | 7.2% |
| Interquartile Range (IQR) | 2.6% | 1.7% |
| Standard Deviation (Sample) | 3.9% | 2.4% |
| Standard Deviation (Population) | 3.9% | 2.3% |
Similar Demographics by Ambulatory Disability
Demographics Similar to Hondurans by Ambulatory Disability
In terms of ambulatory disability, the demographic groups most similar to Hondurans are Liberian (6.3%, a difference of 0.17%), Immigrants from Honduras (6.3%, a difference of 0.27%), Slavic (6.4%, a difference of 0.27%), German Russian (6.3%, a difference of 0.56%), and Hungarian (6.3%, a difference of 0.59%).
| Demographics | Rating | Rank | Ambulatory Disability |
| Guamanians/Chamorros | 10.6 /100 | #218 | Poor 6.3% |
| Indonesians | 9.9 /100 | #219 | Tragic 6.3% |
| Immigrants | Albania | 9.6 /100 | #220 | Tragic 6.3% |
| Hungarians | 9.6 /100 | #221 | Tragic 6.3% |
| German Russians | 9.4 /100 | #222 | Tragic 6.3% |
| Immigrants | Honduras | 7.6 /100 | #223 | Tragic 6.3% |
| Liberians | 7.1 /100 | #224 | Tragic 6.3% |
| Hondurans | 6.3 /100 | #225 | Tragic 6.3% |
| Slavs | 5.1 /100 | #226 | Tragic 6.4% |
| Cubans | 4.0 /100 | #227 | Tragic 6.4% |
| Portuguese | 4.0 /100 | #228 | Tragic 6.4% |
| Czechoslovakians | 3.8 /100 | #229 | Tragic 6.4% |
| Mexicans | 3.5 /100 | #230 | Tragic 6.4% |
| Panamanians | 3.1 /100 | #231 | Tragic 6.4% |
| Assyrians/Chaldeans/Syriacs | 2.4 /100 | #232 | Tragic 6.4% |
Demographics Similar to Immigrants from Uruguay by Ambulatory Disability
In terms of ambulatory disability, the demographic groups most similar to Immigrants from Uruguay are Immigrants from Poland (5.9%, a difference of 0.060%), South African (5.9%, a difference of 0.22%), South American Indian (5.9%, a difference of 0.26%), Immigrants from Africa (5.9%, a difference of 0.28%), and Danish (5.8%, a difference of 0.35%).
| Demographics | Rating | Rank | Ambulatory Disability |
| Immigrants | Morocco | 97.3 /100 | #106 | Exceptional 5.8% |
| Uruguayans | 97.2 /100 | #107 | Exceptional 5.8% |
| Colombians | 97.2 /100 | #108 | Exceptional 5.8% |
| Immigrants | Netherlands | 97.1 /100 | #109 | Exceptional 5.8% |
| Immigrants | Colombia | 96.7 /100 | #110 | Exceptional 5.8% |
| Danes | 96.6 /100 | #111 | Exceptional 5.8% |
| South Africans | 96.3 /100 | #112 | Exceptional 5.9% |
| Immigrants | Uruguay | 95.6 /100 | #113 | Exceptional 5.9% |
| Immigrants | Poland | 95.4 /100 | #114 | Exceptional 5.9% |
| South American Indians | 94.8 /100 | #115 | Exceptional 5.9% |
| Immigrants | Africa | 94.7 /100 | #116 | Exceptional 5.9% |
| Immigrants | South Eastern Asia | 93.6 /100 | #117 | Exceptional 5.9% |
| Russians | 93.4 /100 | #118 | Exceptional 5.9% |
| Norwegians | 93.1 /100 | #119 | Exceptional 5.9% |
| Estonians | 92.9 /100 | #120 | Exceptional 5.9% |