Honduran vs Immigrants from Barbados Ambulatory Disability
COMPARE
Honduran
Immigrants from Barbados
Ambulatory Disability
Ambulatory Disability Comparison
Hondurans
Immigrants from Barbados
6.3%
AMBULATORY DISABILITY
6.3/ 100
METRIC RATING
225th/ 347
METRIC RANK
6.8%
AMBULATORY DISABILITY
0.0/ 100
METRIC RATING
283rd/ 347
METRIC RANK
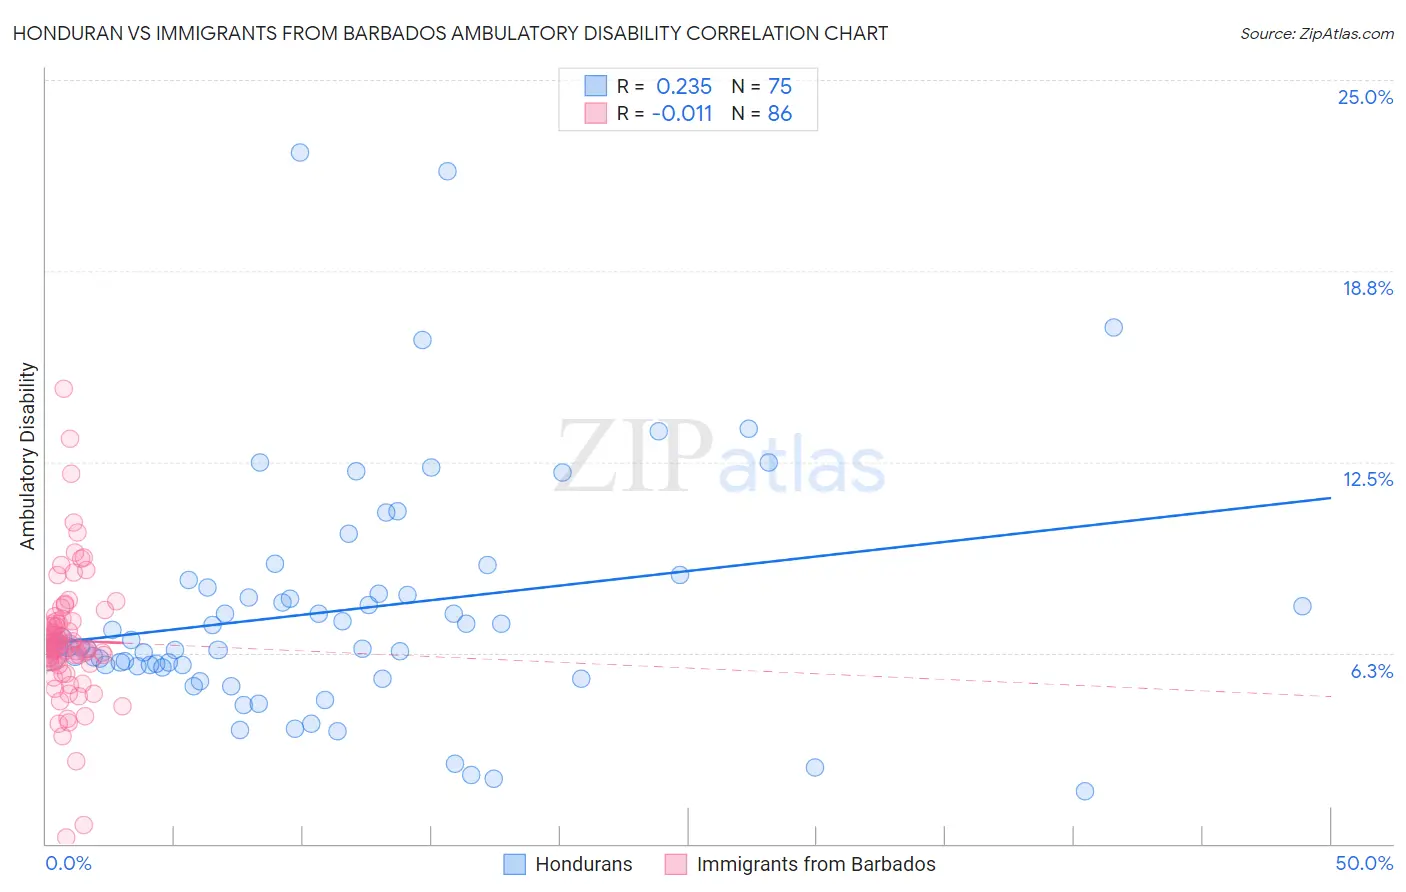
Honduran vs Immigrants from Barbados Ambulatory Disability Correlation Chart
The statistical analysis conducted on geographies consisting of 357,719,276 people shows a weak positive correlation between the proportion of Hondurans and percentage of population with ambulatory disability in the United States with a correlation coefficient (R) of 0.235 and weighted average of 6.3%. Similarly, the statistical analysis conducted on geographies consisting of 112,777,280 people shows no correlation between the proportion of Immigrants from Barbados and percentage of population with ambulatory disability in the United States with a correlation coefficient (R) of -0.011 and weighted average of 6.8%, a difference of 6.9%.
Ambulatory Disability Correlation Summary
| Measurement | Honduran | Immigrants from Barbados |
| Minimum | 1.7% | 0.21% |
| Maximum | 22.6% | 14.9% |
| Range | 20.9% | 14.7% |
| Mean | 7.6% | 6.7% |
| Median | 6.4% | 6.5% |
| Interquartile 25% (IQ1) | 5.8% | 5.9% |
| Interquartile 75% (IQ3) | 8.4% | 7.3% |
| Interquartile Range (IQR) | 2.6% | 1.4% |
| Standard Deviation (Sample) | 3.9% | 2.1% |
| Standard Deviation (Population) | 3.9% | 2.1% |
Similar Demographics by Ambulatory Disability
Demographics Similar to Hondurans by Ambulatory Disability
In terms of ambulatory disability, the demographic groups most similar to Hondurans are Liberian (6.3%, a difference of 0.17%), Immigrants from Honduras (6.3%, a difference of 0.27%), Slavic (6.4%, a difference of 0.27%), German Russian (6.3%, a difference of 0.56%), and Hungarian (6.3%, a difference of 0.59%).
| Demographics | Rating | Rank | Ambulatory Disability |
| Guamanians/Chamorros | 10.6 /100 | #218 | Poor 6.3% |
| Indonesians | 9.9 /100 | #219 | Tragic 6.3% |
| Immigrants | Albania | 9.6 /100 | #220 | Tragic 6.3% |
| Hungarians | 9.6 /100 | #221 | Tragic 6.3% |
| German Russians | 9.4 /100 | #222 | Tragic 6.3% |
| Immigrants | Honduras | 7.6 /100 | #223 | Tragic 6.3% |
| Liberians | 7.1 /100 | #224 | Tragic 6.3% |
| Hondurans | 6.3 /100 | #225 | Tragic 6.3% |
| Slavs | 5.1 /100 | #226 | Tragic 6.4% |
| Cubans | 4.0 /100 | #227 | Tragic 6.4% |
| Portuguese | 4.0 /100 | #228 | Tragic 6.4% |
| Czechoslovakians | 3.8 /100 | #229 | Tragic 6.4% |
| Mexicans | 3.5 /100 | #230 | Tragic 6.4% |
| Panamanians | 3.1 /100 | #231 | Tragic 6.4% |
| Assyrians/Chaldeans/Syriacs | 2.4 /100 | #232 | Tragic 6.4% |
Demographics Similar to Immigrants from Barbados by Ambulatory Disability
In terms of ambulatory disability, the demographic groups most similar to Immigrants from Barbados are Immigrants from Jamaica (6.8%, a difference of 0.070%), Barbadian (6.8%, a difference of 0.16%), Yaqui (6.8%, a difference of 0.28%), Pennsylvania German (6.8%, a difference of 0.36%), and Immigrants from Caribbean (6.7%, a difference of 0.45%).
| Demographics | Rating | Rank | Ambulatory Disability |
| Celtics | 0.1 /100 | #276 | Tragic 6.7% |
| Jamaicans | 0.1 /100 | #277 | Tragic 6.7% |
| Immigrants | West Indies | 0.1 /100 | #278 | Tragic 6.7% |
| Immigrants | Caribbean | 0.0 /100 | #279 | Tragic 6.7% |
| Pennsylvania Germans | 0.0 /100 | #280 | Tragic 6.8% |
| Yaqui | 0.0 /100 | #281 | Tragic 6.8% |
| Barbadians | 0.0 /100 | #282 | Tragic 6.8% |
| Immigrants | Barbados | 0.0 /100 | #283 | Tragic 6.8% |
| Immigrants | Jamaica | 0.0 /100 | #284 | Tragic 6.8% |
| Fijians | 0.0 /100 | #285 | Tragic 6.8% |
| Yakama | 0.0 /100 | #286 | Tragic 6.8% |
| U.S. Virgin Islanders | 0.0 /100 | #287 | Tragic 6.8% |
| Immigrants | Nonimmigrants | 0.0 /100 | #288 | Tragic 6.9% |
| Immigrants | Dominica | 0.0 /100 | #289 | Tragic 6.9% |
| Scotch-Irish | 0.0 /100 | #290 | Tragic 6.9% |